 Please show work or give explanation for this question.
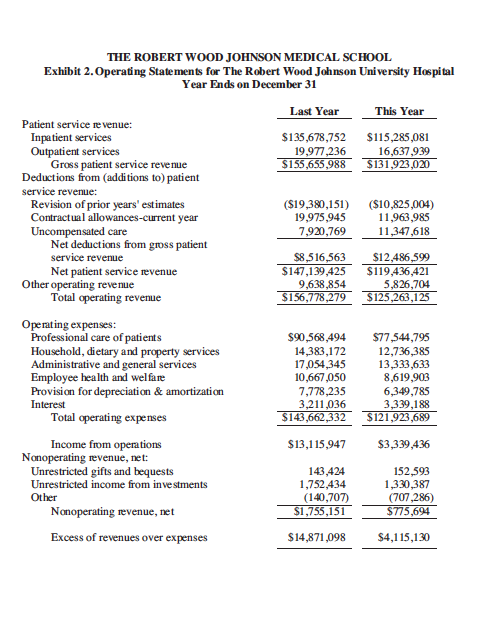
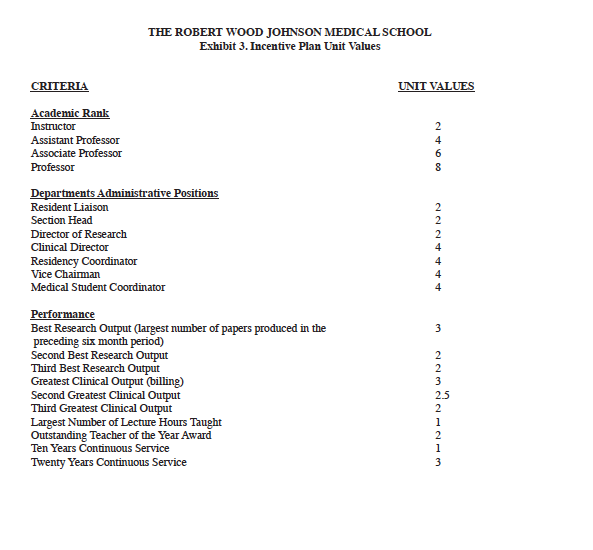
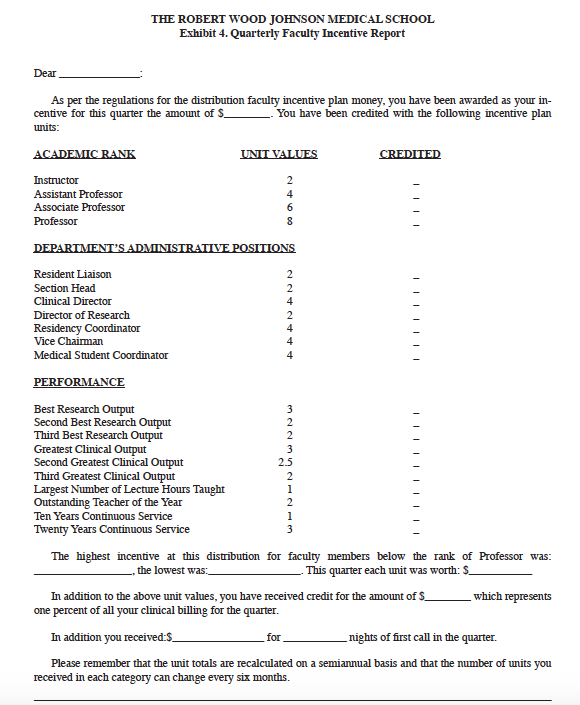
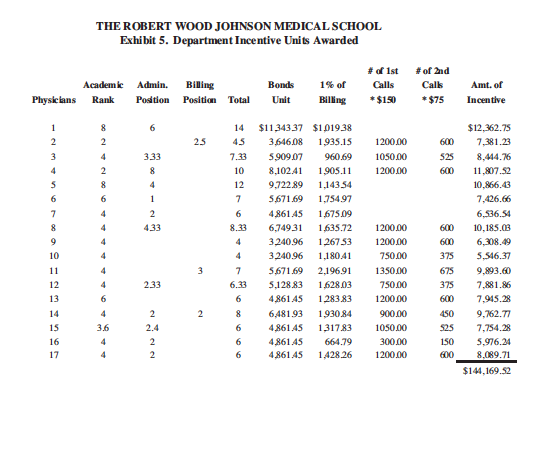
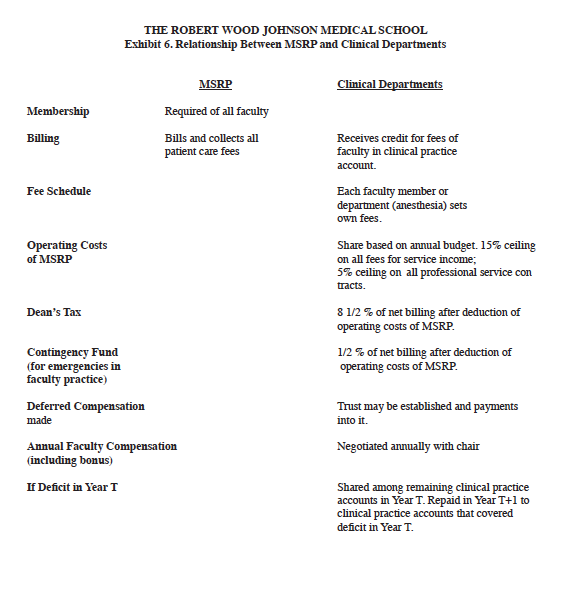
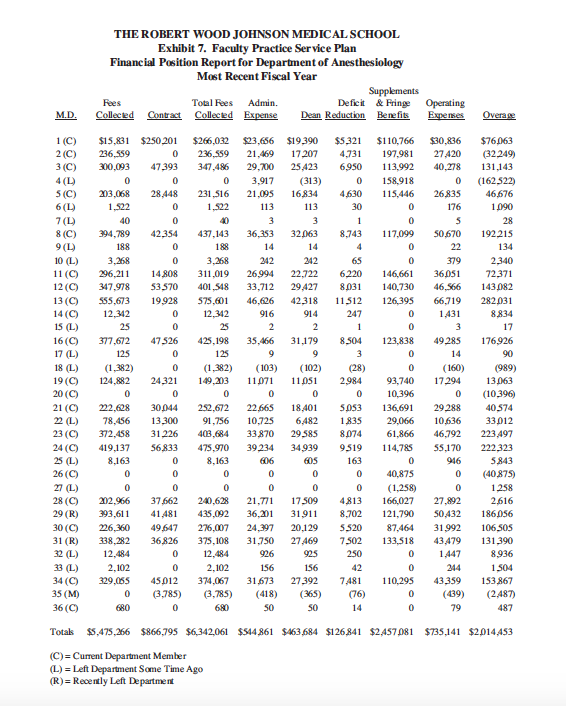
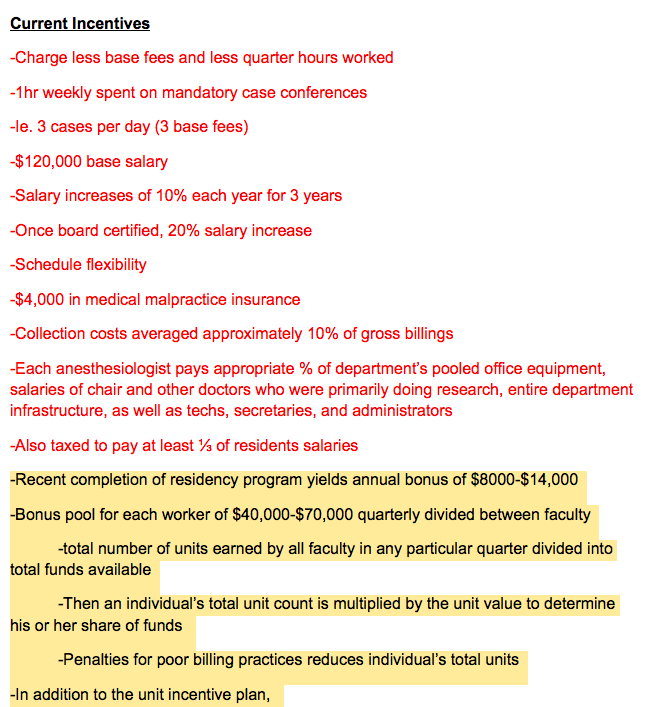
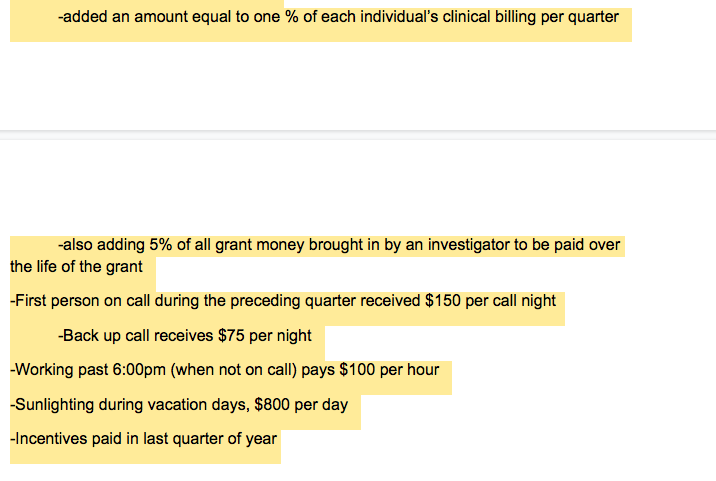
THE ROBERT WOOD JOHNSON MEDICAL SCHOOL Exhibit 2. Operating Statements for The Robert Wood Johnson University Hospital Year Ends on December 31 Last Year This Year Patient service revenue: Inpatient services $135,678,752 $115,285,081 Outpatient services 19,977,236 16,637,939 Gross patient service revenue $155,655,988 $131,923,020 Deductions from (additions to) patient service revenue: Revision of prior years' estimates ($19,380,151) ($10,825,004) Contractual allowances-current year 19,975,945 11,963,985 Uncompensated care 7,920,769 11,347,618 Net deductions from gross patient service revenue $8,516,563 $12,486,599 Net patient service revenue $147,139,425 $119,436,421 Other operating revenue 9,638,854 5,826,704 Total operating revenue $156,778,279 $125,263,125 Operating expenses: Professional care of patients $90,568,494 $77,544,795 Household, dietary and property services 14,383,172 12,736,385 Administrative and general services 17,054,345 13,333,633 Employee health and welfare 10,667,050 8,619,903 Provision for depreciation & amortization 7,778,235 6,349,785 Interest 3,211,036 3,339,188 Total operating expenses $143,662,332 $121,923,689 Income from operations $13,115,947 $3,339,436 Nonoperating revenue, net: Unrestricted gifts and bequests 143,424 152,593 Unrestricted income from investments 1,752,434 1,330,387 Other (140,707) (707,286) Nonoperating revenue, net $1,755,151 $775,694 Excess of revenues over expenses $14,871,098 $4,115,130 THE ROBERT WOOD JOHNSON MEDICAL SCHOOL Exhibit 3. Incentive Plan Unit Values CRITERIA UNIT VALUES Academic Rank Instructor Assistant Professor Associate Professor Professor 2 4 6 8 2 2 4 4 4 Departments Administrative Positions Resident Liaison Section Head Director of Research Clinical Director Residency Coordinator Vice Chaimman Medical Student Coordinator Performance Best Research Output (largest number of papers produced in the preceding six month period) Second Best Research Output Third Best Research Output Greatest Clinical Output (billing) Second Greatest Clinical Output Third Greatest Clinical Output Largest Number of Lecture Hours Taught Outstanding Teacher of the Year Award Ten Years Continuous Service Twenty Years Continuous Service 3 2 2 3 25 2 1 2 1 3 THE ROBERT WOOD JOHNSON MEDICAL SCHOOL Exhibit 4. Quarterly Faculty Incentive Report Dear 2 4 4 As per the regulations for the distribution faculty incentive plan money, you have been awarded as your in- centive for this quarter the amount of $_ You have been credited with the following incentive plan units: ACADEMIC RANK UNT VALUES CREDITED Instructor Assistant Professor 4 Associate Professor 6 Professor 8 DEPARTMENT'S ADMINISTRATIVE POSITIONS Resident Liaison 2 Section Head Clinical Director Director of Research Residency Coordinator Vice Chairman Medical Student Coordinator PERFORMANCE Best Research Output 3 Second Best Research Output 2 Third Best Research Output 2 Greatest Clinical Output 3 Second Greatest Clinical Output 25 Third Greatest Clinical Output 2 Largest Number of Lecture Hours Taught 1 Outstanding Teacher of the Year 2 Ten Years Continuous Service 1 Twenty Years Continuous Service 3 The highest incentive at this distribution for faculty members below the rank of Professor was: the lowest was: This quarter each unit was worth: $ In addition to the above unit values, you have received credit for the amount of $_ which represents one percent of all your clinical billing for the quarter. In addition you received:$_ for nights of first call in the quarter. Please remember that the unit totals are recalculated on a semiannual basis and that the number of units you received in each category can change every six months. THE ROBERT WOOD JOHNSON MEDICAL SCHOOL Exhibit 5. Department Incentive Units Awarded Academic Admin. Biling Physicians Rank Position Position Total Bonds Unit 1% of Billing # Ist Calls * $150 #of 2nd Calls *$75 Amt, of Incentive 6 1 2 3 8 2 25 600 525 600 1200.00 1050.00 1200.00 333 8 4 1 45 7.33 10 12 7 6 4 2 8 6 4 5 6 7 8 9 2 433 8.33 $1134337 $1.01938 3.646.08 1.935.15 5.909.07 960.69 8.102.41 1.905.11 9.722.89 1.143 54 5.671.69 1.75497 4.861.45 1.675.09 6.74931 1.635.72 3.240.96 1 26753 3.240.96 1.18041 5.671.69 2.196.91 5.128.83 1.628.03 4861.45 1283.83 6,481.93 1.930.84 4.861 AS 1.31783 4.861.45 664.79 4861.45 1,428.26 10 $12,362.75 7,381.23 8,444.76 11.807.52 10.866.43 7.426.66 6.536.54 10,185.03 6,308.49 5.546.37 9.893.60 7.881.86 7.945.28 9,762.77 7,754.28 5.976.24 8.089.71 $144,169.52 4 4 4 4 6 233 11 12 13 14 15 16 17 1200.00 1200.00 750.00 1350.00 750.00 1200.00 900.00 1050.00 300.00 1200.00 600 600 375 675 375 600 450 $25 150 600 2 7 6.33 6 8 6 6 6 2 4 3.6 2 THE ROBERT WOOD JOHNSON MEDICAL SCHOOL Exhibit 6. Relationship Between MSRP and Clinical Departments Clinical Departments Membership Billing MSRP Required of all faculty Bills and collects all patient care fees Fee Schedule Operating Costs of MSRP Receives credit for fees of faculty in clinical practice account Each faculty member or department (anesthesia) sets own fees. Share based on annual budget. 15% ceiling on all fees for service income; 5% ceiling on all professional service con tracts. 8 1/2 % of net billing after deduction of operating costs of MSRP 1/2 % of net billing after deduction of operating costs of MSRP Dean's Tax Contingency Fund (for emergencies in faculty practice) Deferred Compensation made Trust may be established and payments into it. Negotiated annually with chair Annual Faculty Compensation including bonus) If Deficit in Year T Shared among remaining clinical practice accounts in Year T. Repaid in Year T+1 to clinical practice accounts that covered deficit in Year T. M.D Overage 1 (C) 2 (C) 3 (C) 8031 916 THE ROBERT WOOD JOHNSON MEDICAL SCHOOL Exhibit 7. Faculty Practice Service Plan Financial Position Report for Department of Anesthesiology Most Recent Fiscal Year Supplements Fees Total Fees Admin. Deficit & Fringe Operating Collected Contract Collected Expense Dean Reduction Benefits Expenses $15,831 $250201 $266,032 23,656 $19.390 $5321 $110,766 $30,836 236,559 0 236,559 21.469 17207 4,731 197,981 27420 300.093 47393 347.486 29,700 25.423 6,950 113.992 40.278 0 0 0 3.917 (313) 0 158.918 0 203.068 28.448 231.516 21.095 16.834 4,630 115,446 26835 1.522 0 1.522 113 113 30 0 176 40 0 3 3 1 0 5 394,789 42354 437.143 36.353 32.063 8.743 117,099 50.670 188 0 188 14 14 4 0 22 3,268 0 3,268 242 242 65 0 379 296,211 14.808 311,019 26,994 22.722 6.220 146,661 36.051 347.978 53570 401,548 33,712 29.427 140,730 46.566 SS5,673 19.928 $75,601 46.626 42318 11 512 126,395 66,719 12,342 0 12,342 247 0 1,431 25 0 25 2 2 1 0 3 377.672 47526 425,198 35,456 31,179 8.504 123,838 49285 125 0 125 9 9 3 0 (1,382) 0 (1,382) (103) (102) (28) 0 (160) 124.882 24321 149.203 11.071 11.051 2.984 93,740 17294 0 0 0 0 0 0 10,396 0 22.628 30.044 252,672 22.665 18.401 SOS3 136,691 29.288 78.456 13,300 91,756 10,725 6.482 1835 29.066 10.636 372.458 31226 403,684 33870 29.585 8.074 61,866 46,792 419.137 56833 475.970 39.234 34.939 9.519 114,78 55,170 8.163 0 8,163 606 605 0 0 0 0 0 0 0 40,875 0 0 0 0 0 0 0 (1,258) 0 202.966 37.662 240.628 21.771 17.509 4813 166,027 27,892 393.611 41481 435,092 36,201 31911 8,702 121,790 50.432 226,360 49.647 276.007 24,397 20,129 5520 87,464 31.992 338,282 36.826 375,108 31.750 27.469 133,518 43.479 12.484 0 12,484 926 925 250 0 1.447 2.102 0 2,102 156 42 0 244 329,055 45.012 374,067 31.673 27.392 7,481 110,295 43,359 0 (3.785) (3.785) (418) (365) (76) 0 (439) 0 680 50 SO 0 79 S(C) 6 (L) 7(L) 8 (C) 9 (L) 10 (L) 11(C) 12 (C) 13 (0) 14(C) 15 (L) 16 (C) 17 (L) 18 (L) 19 (C) 20(C) 21 (C) 22 (L) 23 (C) 24(C) 25 (L) 26 (C) 27 (L) 28 (C) 29 (R) 30 (C) 31 (R) 32 (L) 33 (L.) 34 (C) 35 (M) 36 (C) 914 $76063 (32249) 131.143 (162.522) 46.676 1.090 28 192.215 134 2.340 72371 143082 282.031 8.834 17 176.926 90 (989) 13.063 (10,396) 40.574 33012 223,497 222.323 5843 (40.875) 1258 2.616 186.056 106.505 131,390 8.936 1.504 153867 (2.487) 487 163 946 7502 156 Totals $5,475,266 $866,795 $6,342,061 $44.861 $463.684 $126841 $2,457,081 $735,141 $2014,A53 (C)= Current Department Member (L) = Left Department Some Time Ago (R)= Recently Left Department Current Incentives -Charge less base fees and less quarter hours worked -1hr weekly spent on mandatory case conferences -le. 3 cases per day (3 base fees) -$120,000 base salary -Salary increases of 10% each year for 3 years -Once board certified, 20% salary increase -Schedule flexibility -$4,000 in medical malpractice insurance - Collection costs averaged approximately 10% of gross billings -Each anesthesiologist pays appropriate % of department's pooled office equipment, salaries of chair and other doctors who were primarily doing research, entire department infrastructure, as well as techs, secretaries, and administrators -Also taxed to pay at least 1 of residents salaries -Recent completion of residency program yields annual bonus of $8000-$14,000 -Bonus pool for each worker of $40,000-$70,000 quarterly divided between faculty -total number of units earned by all faculty in any particular quarter divided into total funds available -Then an individual's total unit count is multiplied by the unit value to determine his or her share of funds -Penalties for poor billing practices reduces individual's total units -In addition to the unit incentive plan, -added an amount equal to one % of each individual's clinical billing per quarter -also adding 5% of all grant money brought in by an investigator to be paid over the life of the grant -First person on call during the preceding quarter received $150 per call night -Back up call receives $75 per night -Working past 6:00pm (when not on call) pays $100 per hour -Sunlighting during vacation days, $800 per day -Incentives paid in last quarter of year [5 points] Calculate the current incentives available to a physician against other ways for a physician to improve their compensation. Given the current plan from Dr. Klein, describe other incentive options that he might want to consider. What would those do to the commitment to research and teaching? THE ROBERT WOOD JOHNSON MEDICAL SCHOOL Exhibit 2. Operating Statements for The Robert Wood Johnson University Hospital Year Ends on December 31 Last Year This Year Patient service revenue: Inpatient services $135,678,752 $115,285,081 Outpatient services 19,977,236 16,637,939 Gross patient service revenue $155,655,988 $131,923,020 Deductions from (additions to) patient service revenue: Revision of prior years' estimates ($19,380,151) ($10,825,004) Contractual allowances-current year 19,975,945 11,963,985 Uncompensated care 7,920,769 11,347,618 Net deductions from gross patient service revenue $8,516,563 $12,486,599 Net patient service revenue $147,139,425 $119,436,421 Other operating revenue 9,638,854 5,826,704 Total operating revenue $156,778,279 $125,263,125 Operating expenses: Professional care of patients $90,568,494 $77,544,795 Household, dietary and property services 14,383,172 12,736,385 Administrative and general services 17,054,345 13,333,633 Employee health and welfare 10,667,050 8,619,903 Provision for depreciation & amortization 7,778,235 6,349,785 Interest 3,211,036 3,339,188 Total operating expenses $143,662,332 $121,923,689 Income from operations $13,115,947 $3,339,436 Nonoperating revenue, net: Unrestricted gifts and bequests 143,424 152,593 Unrestricted income from investments 1,752,434 1,330,387 Other (140,707) (707,286) Nonoperating revenue, net $1,755,151 $775,694 Excess of revenues over expenses $14,871,098 $4,115,130 THE ROBERT WOOD JOHNSON MEDICAL SCHOOL Exhibit 3. Incentive Plan Unit Values CRITERIA UNIT VALUES Academic Rank Instructor Assistant Professor Associate Professor Professor 2 4 6 8 2 2 4 4 4 Departments Administrative Positions Resident Liaison Section Head Director of Research Clinical Director Residency Coordinator Vice Chaimman Medical Student Coordinator Performance Best Research Output (largest number of papers produced in the preceding six month period) Second Best Research Output Third Best Research Output Greatest Clinical Output (billing) Second Greatest Clinical Output Third Greatest Clinical Output Largest Number of Lecture Hours Taught Outstanding Teacher of the Year Award Ten Years Continuous Service Twenty Years Continuous Service 3 2 2 3 25 2 1 2 1 3 THE ROBERT WOOD JOHNSON MEDICAL SCHOOL Exhibit 4. Quarterly Faculty Incentive Report Dear 2 4 4 As per the regulations for the distribution faculty incentive plan money, you have been awarded as your in- centive for this quarter the amount of $_ You have been credited with the following incentive plan units: ACADEMIC RANK UNT VALUES CREDITED Instructor Assistant Professor 4 Associate Professor 6 Professor 8 DEPARTMENT'S ADMINISTRATIVE POSITIONS Resident Liaison 2 Section Head Clinical Director Director of Research Residency Coordinator Vice Chairman Medical Student Coordinator PERFORMANCE Best Research Output 3 Second Best Research Output 2 Third Best Research Output 2 Greatest Clinical Output 3 Second Greatest Clinical Output 25 Third Greatest Clinical Output 2 Largest Number of Lecture Hours Taught 1 Outstanding Teacher of the Year 2 Ten Years Continuous Service 1 Twenty Years Continuous Service 3 The highest incentive at this distribution for faculty members below the rank of Professor was: the lowest was: This quarter each unit was worth: $ In addition to the above unit values, you have received credit for the amount of $_ which represents one percent of all your clinical billing for the quarter. In addition you received:$_ for nights of first call in the quarter. Please remember that the unit totals are recalculated on a semiannual basis and that the number of units you received in each category can change every six months. THE ROBERT WOOD JOHNSON MEDICAL SCHOOL Exhibit 5. Department Incentive Units Awarded Academic Admin. Biling Physicians Rank Position Position Total Bonds Unit 1% of Billing # Ist Calls * $150 #of 2nd Calls *$75 Amt, of Incentive 6 1 2 3 8 2 25 600 525 600 1200.00 1050.00 1200.00 333 8 4 1 45 7.33 10 12 7 6 4 2 8 6 4 5 6 7 8 9 2 433 8.33 $1134337 $1.01938 3.646.08 1.935.15 5.909.07 960.69 8.102.41 1.905.11 9.722.89 1.143 54 5.671.69 1.75497 4.861.45 1.675.09 6.74931 1.635.72 3.240.96 1 26753 3.240.96 1.18041 5.671.69 2.196.91 5.128.83 1.628.03 4861.45 1283.83 6,481.93 1.930.84 4.861 AS 1.31783 4.861.45 664.79 4861.45 1,428.26 10 $12,362.75 7,381.23 8,444.76 11.807.52 10.866.43 7.426.66 6.536.54 10,185.03 6,308.49 5.546.37 9.893.60 7.881.86 7.945.28 9,762.77 7,754.28 5.976.24 8.089.71 $144,169.52 4 4 4 4 6 233 11 12 13 14 15 16 17 1200.00 1200.00 750.00 1350.00 750.00 1200.00 900.00 1050.00 300.00 1200.00 600 600 375 675 375 600 450 $25 150 600 2 7 6.33 6 8 6 6 6 2 4 3.6 2 THE ROBERT WOOD JOHNSON MEDICAL SCHOOL Exhibit 6. Relationship Between MSRP and Clinical Departments Clinical Departments Membership Billing MSRP Required of all faculty Bills and collects all patient care fees Fee Schedule Operating Costs of MSRP Receives credit for fees of faculty in clinical practice account Each faculty member or department (anesthesia) sets own fees. Share based on annual budget. 15% ceiling on all fees for service income; 5% ceiling on all professional service con tracts. 8 1/2 % of net billing after deduction of operating costs of MSRP 1/2 % of net billing after deduction of operating costs of MSRP Dean's Tax Contingency Fund (for emergencies in faculty practice) Deferred Compensation made Trust may be established and payments into it. Negotiated annually with chair Annual Faculty Compensation including bonus) If Deficit in Year T Shared among remaining clinical practice accounts in Year T. Repaid in Year T+1 to clinical practice accounts that covered deficit in Year T. M.D Overage 1 (C) 2 (C) 3 (C) 8031 916 THE ROBERT WOOD JOHNSON MEDICAL SCHOOL Exhibit 7. Faculty Practice Service Plan Financial Position Report for Department of Anesthesiology Most Recent Fiscal Year Supplements Fees Total Fees Admin. Deficit & Fringe Operating Collected Contract Collected Expense Dean Reduction Benefits Expenses $15,831 $250201 $266,032 23,656 $19.390 $5321 $110,766 $30,836 236,559 0 236,559 21.469 17207 4,731 197,981 27420 300.093 47393 347.486 29,700 25.423 6,950 113.992 40.278 0 0 0 3.917 (313) 0 158.918 0 203.068 28.448 231.516 21.095 16.834 4,630 115,446 26835 1.522 0 1.522 113 113 30 0 176 40 0 3 3 1 0 5 394,789 42354 437.143 36.353 32.063 8.743 117,099 50.670 188 0 188 14 14 4 0 22 3,268 0 3,268 242 242 65 0 379 296,211 14.808 311,019 26,994 22.722 6.220 146,661 36.051 347.978 53570 401,548 33,712 29.427 140,730 46.566 SS5,673 19.928 $75,601 46.626 42318 11 512 126,395 66,719 12,342 0 12,342 247 0 1,431 25 0 25 2 2 1 0 3 377.672 47526 425,198 35,456 31,179 8.504 123,838 49285 125 0 125 9 9 3 0 (1,382) 0 (1,382) (103) (102) (28) 0 (160) 124.882 24321 149.203 11.071 11.051 2.984 93,740 17294 0 0 0 0 0 0 10,396 0 22.628 30.044 252,672 22.665 18.401 SOS3 136,691 29.288 78.456 13,300 91,756 10,725 6.482 1835 29.066 10.636 372.458 31226 403,684 33870 29.585 8.074 61,866 46,792 419.137 56833 475.970 39.234 34.939 9.519 114,78 55,170 8.163 0 8,163 606 605 0 0 0 0 0 0 0 40,875 0 0 0 0 0 0 0 (1,258) 0 202.966 37.662 240.628 21.771 17.509 4813 166,027 27,892 393.611 41481 435,092 36,201 31911 8,702 121,790 50.432 226,360 49.647 276.007 24,397 20,129 5520 87,464 31.992 338,282 36.826 375,108 31.750 27.469 133,518 43.479 12.484 0 12,484 926 925 250 0 1.447 2.102 0 2,102 156 42 0 244 329,055 45.012 374,067 31.673 27.392 7,481 110,295 43,359 0 (3.785) (3.785) (418) (365) (76) 0 (439) 0 680 50 SO 0 79 S(C) 6 (L) 7(L) 8 (C) 9 (L) 10 (L) 11(C) 12 (C) 13 (0) 14(C) 15 (L) 16 (C) 17 (L) 18 (L) 19 (C) 20(C) 21 (C) 22 (L) 23 (C) 24(C) 25 (L) 26 (C) 27 (L) 28 (C) 29 (R) 30 (C) 31 (R) 32 (L) 33 (L.) 34 (C) 35 (M) 36 (C) 914 $76063 (32249) 131.143 (162.522) 46.676 1.090 28 192.215 134 2.340 72371 143082 282.031 8.834 17 176.926 90 (989) 13.063 (10,396) 40.574 33012 223,497 222.323 5843 (40.875) 1258 2.616 186.056 106.505 131,390 8.936 1.504 153867 (2.487) 487 163 946 7502 156 Totals $5,475,266 $866,795 $6,342,061 $44.861 $463.684 $126841 $2,457,081 $735,141 $2014,A53 (C)= Current Department Member (L) = Left Department Some Time Ago (R)= Recently Left Department Current Incentives -Charge less base fees and less quarter hours worked -1hr weekly spent on mandatory case conferences -le. 3 cases per day (3 base fees) -$120,000 base salary -Salary increases of 10% each year for 3 years -Once board certified, 20% salary increase -Schedule flexibility -$4,000 in medical malpractice insurance - Collection costs averaged approximately 10% of gross billings -Each anesthesiologist pays appropriate % of department's pooled office equipment, salaries of chair and other doctors who were primarily doing research, entire department infrastructure, as well as techs, secretaries, and administrators -Also taxed to pay at least 1 of residents salaries -Recent completion of residency program yields annual bonus of $8000-$14,000 -Bonus pool for each worker of $40,000-$70,000 quarterly divided between faculty -total number of units earned by all faculty in any particular quarter divided into total funds available -Then an individual's total unit count is multiplied by the unit value to determine his or her share of funds -Penalties for poor billing practices reduces individual's total units -In addition to the unit incentive plan, -added an amount equal to one % of each individual's clinical billing per quarter -also adding 5% of all grant money brought in by an investigator to be paid over the life of the grant -First person on call during the preceding quarter received $150 per call night -Back up call receives $75 per night -Working past 6:00pm (when not on call) pays $100 per hour -Sunlighting during vacation days, $800 per day -Incentives paid in last quarter of year [5 points] Calculate the current incentives available to a physician against other ways for a physician to improve their compensation. Given the current plan from Dr. Klein, describe other incentive options that he might want to consider. What would those do to the commitment to research and teaching