Answered step by step
Verified Expert Solution
Question
1 Approved Answer
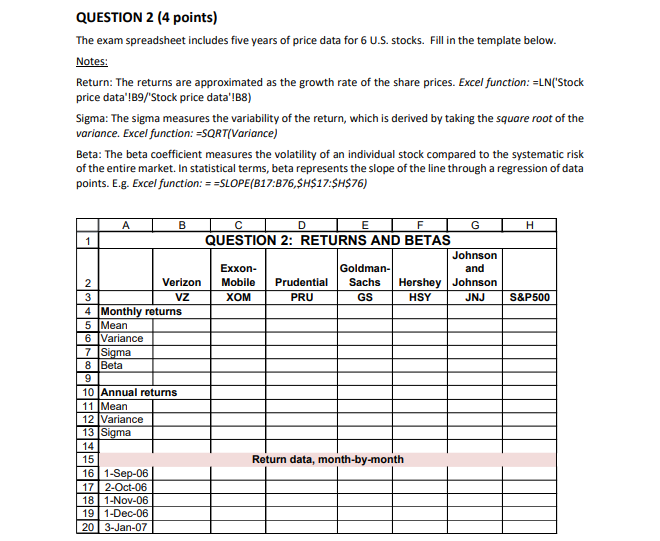
please show work Return data, month by month from 1-Sep-6 to QUESTION 2 (4 points) The exam spreadsheet includes five years of price data for
please show work


Return data, month by month from 1-Sep-6 to
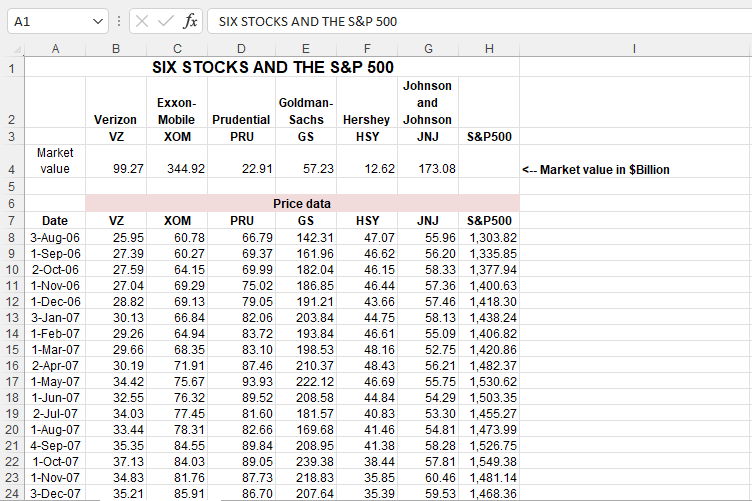
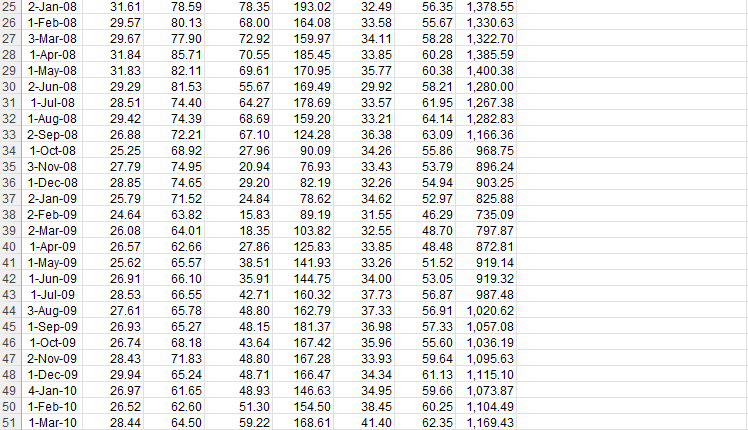
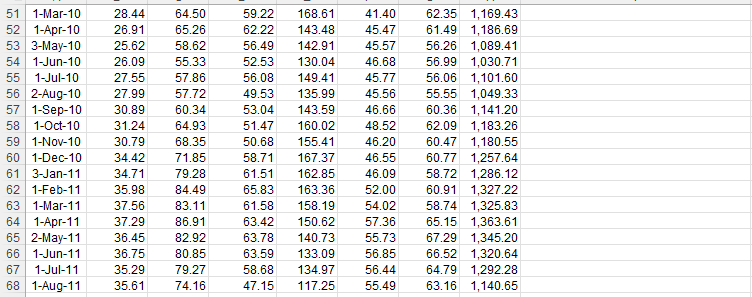
QUESTION 2 (4 points) The exam spreadsheet includes five years of price data for 6 U.S. stocks. Fill in the template below. Notes: Return: The returns are approximated as the growth rate of the share prices. Excel function: ELN('Stock price data"!B9/ Stock price data'!B8) Sigma: The sigma measures the variability of the return, which is derived by taking the square root of the variance. Excel function: =SQRT|Variance) Beta: The beta coefficient measures the volatility of an individual stock compared to the systematic risk of the entire market. In statistical terms, beta represents the slope of the line through a regression of data points. E.g. Excel function: ==SLOPE(B17:B76,SH$17:$H$76) H S&P500 A B D E F 1 QUESTION 2: RETURNS AND BETAS Johnson Exxon- Goldman- and 2 Verizon Mobile Prudential Sachs Hershey Johnson 3 VZ XOM PRU GS HSY JNJ 4 Monthly returns 5 Mean 6 Variance 7 Sigma 8 Beta 9 10 Annual returns 11 Mean 12 Variance 13 Sigma 14 15 Return data, month-by-month 16 1-Sep-06 17 2-Oct-06 181-Nov-06 19 1-Dec-06 20 3-Jan-07 A1 A H x fx SIX STOCKS AND THE S&P 500 B D E F SIX STOCKS AND THE S&P 500 Johnson Exxon- Goldman- and Verizon Mobile Prudential Sachs Hershey Johnson VZ XOM PRU GS HSY JNJ S&P500 99.27 344.92 22.91 57.23 12.62 173.08Step by Step Solution
There are 3 Steps involved in it
Step: 1

Get Instant Access to Expert-Tailored Solutions
See step-by-step solutions with expert insights and AI powered tools for academic success
Step: 2

Step: 3

Ace Your Homework with AI
Get the answers you need in no time with our AI-driven, step-by-step assistance
Get Started


