

Answered step by step
Verified Expert Solution
Question
1 Approved Answer
please show work to help me understand the HW, and ill leave a like! You currently own a home in Eastville, Oregon, and want to
please show work to help me understand the HW, and ill leave a like! 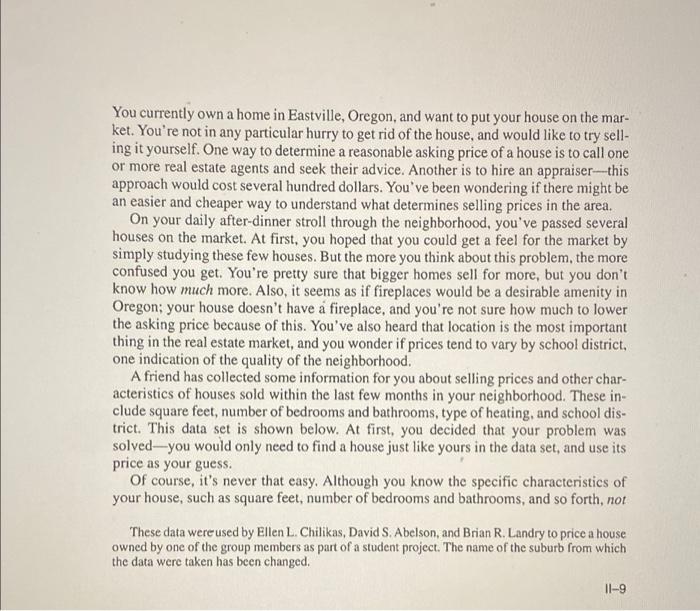
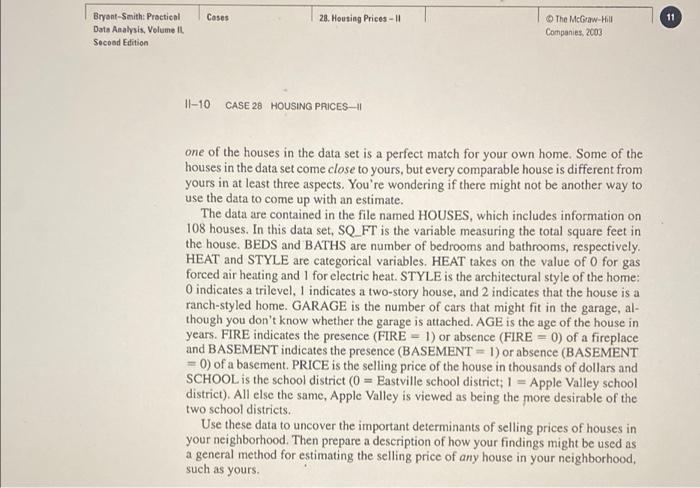
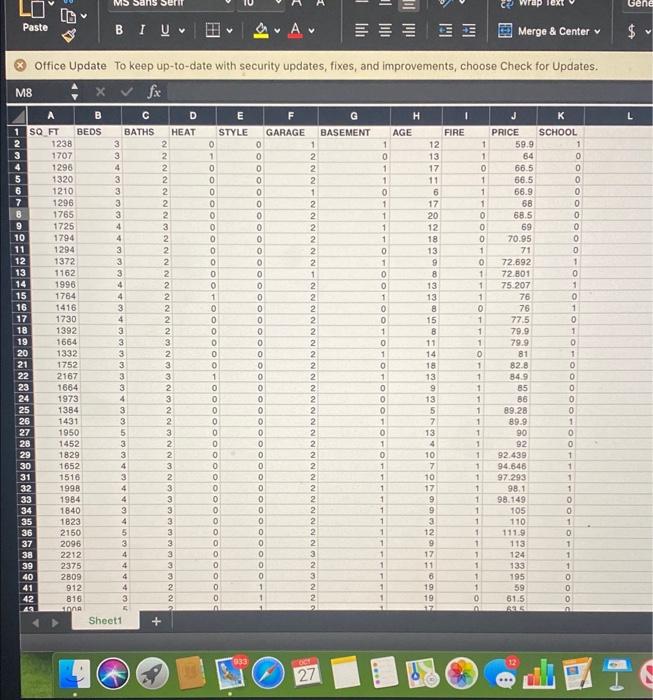
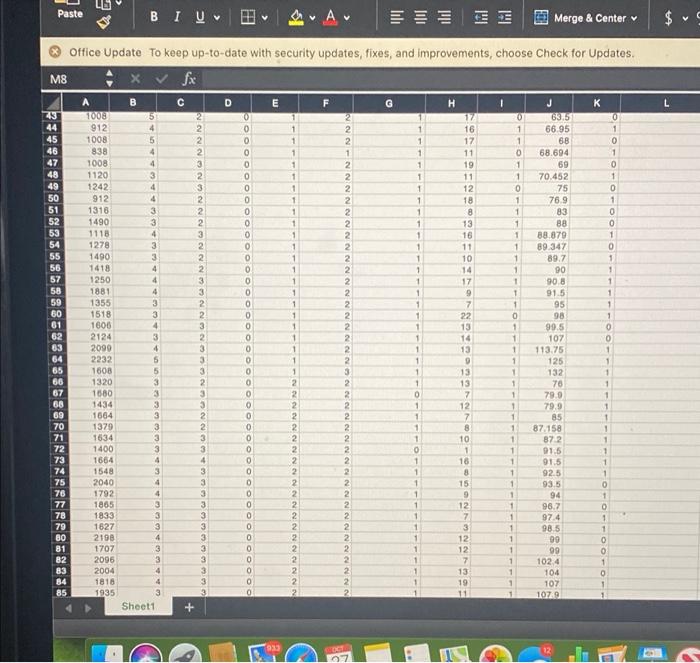
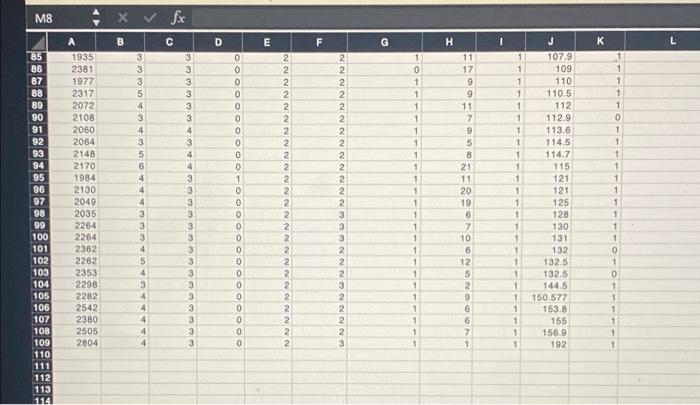
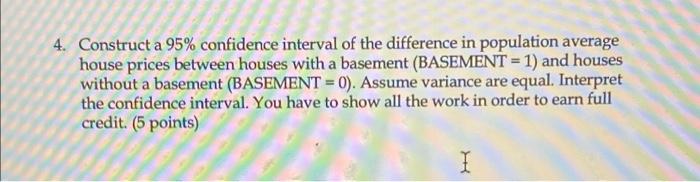
You currently own a home in Eastville, Oregon, and want to put your house on the mar- ket. You're not in any particular hurry to get rid of the house, and would like to try sell- ing it yourself. One way to determine a reasonable asking price of a house is to call one or more real estate agents and seek their advice. Another is to hire an appraiser---this approach would cost several hundred dollars. You've been wondering if there might be an easier and cheaper way to understand what determines selling prices in the area. On your daily after-dinner stroll through the neighborhood, you've passed several houses on the market. At first, you hoped that you could get a feel for the market by simply studying these few houses. But the more you think about this problem, the more confused you get. You're pretty sure that bigger homes sell for more, but you don't know how much more. Also, it seems as if fireplaces would be a desirable amenity in Oregon; your house doesn't have a fireplace, and you're not sure how much to lower the asking price because of this. You've also heard that location is the most important thing in the real estate market, and you wonder if prices tend to vary by school district, one indication of the quality of the neighborhood. A friend has collected some information for you about selling prices and other char- acteristics of houses sold within the last few months in your neighborhood. These in clude square feet, number of bedrooms and bathrooms, type of heating, and school dis- trict. This data set is shown below. At first, you decided that your problem was solved - you would only need to find a house just like yours in the data set, and use its price as your guess. Of course, it's never that easy. Although you know the specific characteristics of your house, such as square feet, number of bedrooms and bathrooms, and so forth, not These data were used by Ellen L. Chilikas, David S. Abelson, and Brian R. Landry to price a house owned by one of the group members as part of a student project. The name of the suburb from which the data were taken has been changed. 11-9 Cases 28. Housing Prices - 1 11 Bryant-Smith: Praction Data Analysis, Volume IL Second Edition The McGraw-Hill Companies, 2003 11-10 CASE 28 HOUSING PRICES-|| one of the houses in the data set is a perfect match for your own home. Some of the houses in the data set come close to yours, but every comparable house is different from yours in at least three aspects. You're wondering if there might not be another way to use the data to come up with an estimate. The data are contained in the file named HOUSES, which includes information on 108 houses. In this data set, SQ FT is the variable measuring the total square feet in the house. BEDS and BATHS are number of bedrooms and bathrooms, respectively. HEAT and STYLE are categorical variables. HEAT takes on the value of 0 for gas forced air heating and I for electric heat. STYLE is the architectural style of the home: O indicates a trilevel, 1 indicates a two-story house, and 2 indicates that the house is a ranch-styled home. GARAGE is the number of cars that might fit in the garage, al- though you don't know whether the garage is attached. AGE is the age of the house in years. FIRE indicates the presence (FIRE - 1) or absence (FIRE = 0) of a fireplace and BASEMENT indicates the presence (BASEMENT - 1) or absence (BASEMENT = 0) of a basement. PRICE is the selling price of the house in thousands of dollars and SCHOOL is the school district (0 = Eastville school district: 1 = Apple Valley school district). All else the same, Apple Valley is viewed as being the more desirable of the two school districts. Use these data to uncover the important determinants of selling prices of houses in your neighborhood. Then prepare a description of how your findings might be used as a general method for estimating the selling price of any house in your neighborhood, such as yours. Paste Iul 1941 BIU A Merge & Center Office Update To keep up-to-date with security updates, fixes, and improvements, choose Check for Updates. : fx E H . M8 D L 23 0 1 1 1 1 1 2 2 2 3 2 3 2 2 2 1 1 1 0 1 1 0 1 1 0 1 1 1 1 1 2 1 1 1 1 1 1 1 1 1 1 A 100B 912 1008 838 1008 1120 1242 912 1318 1490 1118 1278 1490 1418 1250 1881 1355 1518 1600 2124 2090 2232 1608 1320 1680 1434 1004 1379 1634 1400 1664 1548 2040 1792 1865 1833 1627 2198 1707 0 1 0 1 0 1 0 1 0 0 1 0 1 1 1 1 1 1 0 0 1 44 45 46 47 48 49 50 51 52 53 54 55 56 57 58 59 60 61 62 63 64 65 66 67 68 69 70 71 72 73 74 75 70 77 78 79 80 81 82 83 84 85 1 1 1 1 1 5 4 4 3 4 4 3 3 4 3 3 4 4 4 3 3 4 3 4 5 5 3 3 3 3 3 3 3 4 3 4 4 2 3 3 4 3 3 4 4 3 Sheet1 2 2 2 1 2 2 2 2 2 2 2 2. 2 2 2 2 2 2 2 2 2 2 3 2 2 2 2 2 2 2 2 2 2 2 2 2 2 2 2 2 2 2 0 0 0 0 0 0 0 0 O 0 0 O O 0 0 0 0 0 0 O 0 0 0 0 0 0 0 0 0 0 0 0 0 0 0 0 0 0 g 0 0 2 2 2 3 3 2 2 3 2 3 3 3 2 3 3 2 2 3 3 4 3 3 3 3 3 3 3 3 3 3 3 1 1 1 2 1 1 1 1 1 1 1 1 1 1 1 1 1 1 1 1 1 1 1 1 0 1 1 1 1 0 1 1 1 1 1 1 1 1 1 16 17 11 19 11 12 18 8 13 16 11 10 14 17 9 7 22 13 14 13 O 13 13 7 12 7 8 10 1 16 8 15 9 12 7 3 12 12 7 13 19 11 J 635 66.95 68 68.694 69 70.452 75 76.9 83 88 88.879 89.347 89.7 90 90.8 91.5 95 98 99.5 107 113.75 125 132 70 790 79.9 85 87.158 872 91.5 91.5 925 93.5 94 96.7 97.4 98.5 90 99 1024 104 107 1079 1 1 0 1 1 1 1 1 1 1 1 1 1 1 1 1 1 1 1 1 1 1 1 1 1 1 1 1 2 2 2 2 2 2 2 2 2 2 2 2 2 2 2 2 1 1 1 1 1 1 1 1 1 1 0 1 0 1 1 0 2096 1 1 2004 1818 1935 1 0 1 1 + M8 x fx B C D D E F G H 1 K L > 2. 1 1 1 1 1 1 1. 1 1 3 3 3 5 4 3 4 3 5 6 4 1 0 1 1 0 0 0 0 0 0 0 0 0 0 1 0 1 1 3 3 3 3 3 3 4 3 4 4 3 3 3 3 3 3 3 3 1 1 A 1935 2381 1977 2317 2072 2108 2060 2064 2148 2170 1984 2130 2049 2035 2264 2264 2362 2262 2353 2298 2282 2542 2380 2505 2804 1 1 0 1 1 1 1 1 1 1 1 1 1 1 1 1 1 1 1 1 1 1 11 17 9 9 11 7 9 5 8 21 11 20 19 6 2 10 6 12 5 2 4 1 85 86 87 88 89 90 91 92 93 94 95 96 97 98 99 100 101 102 103 104 105 106 107 108 109 110 111 112 113 114 2 2 2 2 2 2 2 2 2 2 2 2 2 2 2 2 2 2 2 2 2 2 2. 2 2. 1 1 1 1 1 2 2 2 2 2 2 2 2 2 2 2 2 2 3 3 3 2 2 2 3 2 2 2 2 3 4 J 107.9 109 110 110.5 112 112.9 113.6 114.5 114.7 115 121 121 125 128 130 131 132 132.5 132.5 144.5 150.577 153.8 155 156.9 192 1 1 1 3 3 1 1 1 1 0 O 0 0 0 0 0 0 0 0 D 0 0 4 5 4 3 4 3 1 1 1 1 0 1 0 1 1 1 1 1 1 1 4 1 3 3 3 3 3 3 1 1 1 4 4 4 6 6 7 1 1 1 1 1 4. Construct a 95% confidence interval of the difference in population average house prices between houses with a basement (BASEMENT = 1) and houses without a basement (BASEMENT = 0). Assume variance are equal. Interpret the confidence interval. You have to show all the work in order to earn full credit. (5 points) I I You currently own a home in Eastville, Oregon, and want to put your house on the mar- ket. You're not in any particular hurry to get rid of the house, and would like to try sell- ing it yourself. One way to determine a reasonable asking price of a house is to call one or more real estate agents and seek their advice. Another is to hire an appraiser---this approach would cost several hundred dollars. You've been wondering if there might be an easier and cheaper way to understand what determines selling prices in the area. On your daily after-dinner stroll through the neighborhood, you've passed several houses on the market. At first, you hoped that you could get a feel for the market by simply studying these few houses. But the more you think about this problem, the more confused you get. You're pretty sure that bigger homes sell for more, but you don't know how much more. Also, it seems as if fireplaces would be a desirable amenity in Oregon; your house doesn't have a fireplace, and you're not sure how much to lower the asking price because of this. You've also heard that location is the most important thing in the real estate market, and you wonder if prices tend to vary by school district, one indication of the quality of the neighborhood. A friend has collected some information for you about selling prices and other char- acteristics of houses sold within the last few months in your neighborhood. These in clude square feet, number of bedrooms and bathrooms, type of heating, and school dis- trict. This data set is shown below. At first, you decided that your problem was solved - you would only need to find a house just like yours in the data set, and use its price as your guess. Of course, it's never that easy. Although you know the specific characteristics of your house, such as square feet, number of bedrooms and bathrooms, and so forth, not These data were used by Ellen L. Chilikas, David S. Abelson, and Brian R. Landry to price a house owned by one of the group members as part of a student project. The name of the suburb from which the data were taken has been changed. 11-9 Cases 28. Housing Prices - 1 11 Bryant-Smith: Praction Data Analysis, Volume IL Second Edition The McGraw-Hill Companies, 2003 11-10 CASE 28 HOUSING PRICES-|| one of the houses in the data set is a perfect match for your own home. Some of the houses in the data set come close to yours, but every comparable house is different from yours in at least three aspects. You're wondering if there might not be another way to use the data to come up with an estimate. The data are contained in the file named HOUSES, which includes information on 108 houses. In this data set, SQ FT is the variable measuring the total square feet in the house. BEDS and BATHS are number of bedrooms and bathrooms, respectively. HEAT and STYLE are categorical variables. HEAT takes on the value of 0 for gas forced air heating and I for electric heat. STYLE is the architectural style of the home: O indicates a trilevel, 1 indicates a two-story house, and 2 indicates that the house is a ranch-styled home. GARAGE is the number of cars that might fit in the garage, al- though you don't know whether the garage is attached. AGE is the age of the house in years. FIRE indicates the presence (FIRE - 1) or absence (FIRE = 0) of a fireplace and BASEMENT indicates the presence (BASEMENT - 1) or absence (BASEMENT = 0) of a basement. PRICE is the selling price of the house in thousands of dollars and SCHOOL is the school district (0 = Eastville school district: 1 = Apple Valley school district). All else the same, Apple Valley is viewed as being the more desirable of the two school districts. Use these data to uncover the important determinants of selling prices of houses in your neighborhood. Then prepare a description of how your findings might be used as a general method for estimating the selling price of any house in your neighborhood, such as yours. Paste Iul 1941 BIU A Merge & Center Office Update To keep up-to-date with security updates, fixes, and improvements, choose Check for Updates. : fx E H . M8 D L 23 0 1 1 1 1 1 2 2 2 3 2 3 2 2 2 1 1 1 0 1 1 0 1 1 0 1 1 1 1 1 2 1 1 1 1 1 1 1 1 1 1 A 100B 912 1008 838 1008 1120 1242 912 1318 1490 1118 1278 1490 1418 1250 1881 1355 1518 1600 2124 2090 2232 1608 1320 1680 1434 1004 1379 1634 1400 1664 1548 2040 1792 1865 1833 1627 2198 1707 0 1 0 1 0 1 0 1 0 0 1 0 1 1 1 1 1 1 0 0 1 44 45 46 47 48 49 50 51 52 53 54 55 56 57 58 59 60 61 62 63 64 65 66 67 68 69 70 71 72 73 74 75 70 77 78 79 80 81 82 83 84 85 1 1 1 1 1 5 4 4 3 4 4 3 3 4 3 3 4 4 4 3 3 4 3 4 5 5 3 3 3 3 3 3 3 4 3 4 4 2 3 3 4 3 3 4 4 3 Sheet1 2 2 2 1 2 2 2 2 2 2 2 2. 2 2 2 2 2 2 2 2 2 2 3 2 2 2 2 2 2 2 2 2 2 2 2 2 2 2 2 2 2 2 0 0 0 0 0 0 0 0 O 0 0 O O 0 0 0 0 0 0 O 0 0 0 0 0 0 0 0 0 0 0 0 0 0 0 0 0 0 g 0 0 2 2 2 3 3 2 2 3 2 3 3 3 2 3 3 2 2 3 3 4 3 3 3 3 3 3 3 3 3 3 3 1 1 1 2 1 1 1 1 1 1 1 1 1 1 1 1 1 1 1 1 1 1 1 1 0 1 1 1 1 0 1 1 1 1 1 1 1 1 1 16 17 11 19 11 12 18 8 13 16 11 10 14 17 9 7 22 13 14 13 O 13 13 7 12 7 8 10 1 16 8 15 9 12 7 3 12 12 7 13 19 11 J 635 66.95 68 68.694 69 70.452 75 76.9 83 88 88.879 89.347 89.7 90 90.8 91.5 95 98 99.5 107 113.75 125 132 70 790 79.9 85 87.158 872 91.5 91.5 925 93.5 94 96.7 97.4 98.5 90 99 1024 104 107 1079 1 1 0 1 1 1 1 1 1 1 1 1 1 1 1 1 1 1 1 1 1 1 1 1 1 1 1 1 2 2 2 2 2 2 2 2 2 2 2 2 2 2 2 2 1 1 1 1 1 1 1 1 1 1 0 1 0 1 1 0 2096 1 1 2004 1818 1935 1 0 1 1 + M8 x fx B C D D E F G H 1 K L > 2. 1 1 1 1 1 1 1. 1 1 3 3 3 5 4 3 4 3 5 6 4 1 0 1 1 0 0 0 0 0 0 0 0 0 0 1 0 1 1 3 3 3 3 3 3 4 3 4 4 3 3 3 3 3 3 3 3 1 1 A 1935 2381 1977 2317 2072 2108 2060 2064 2148 2170 1984 2130 2049 2035 2264 2264 2362 2262 2353 2298 2282 2542 2380 2505 2804 1 1 0 1 1 1 1 1 1 1 1 1 1 1 1 1 1 1 1 1 1 1 11 17 9 9 11 7 9 5 8 21 11 20 19 6 2 10 6 12 5 2 4 1 85 86 87 88 89 90 91 92 93 94 95 96 97 98 99 100 101 102 103 104 105 106 107 108 109 110 111 112 113 114 2 2 2 2 2 2 2 2 2 2 2 2 2 2 2 2 2 2 2 2 2 2 2. 2 2. 1 1 1 1 1 2 2 2 2 2 2 2 2 2 2 2 2 2 3 3 3 2 2 2 3 2 2 2 2 3 4 J 107.9 109 110 110.5 112 112.9 113.6 114.5 114.7 115 121 121 125 128 130 131 132 132.5 132.5 144.5 150.577 153.8 155 156.9 192 1 1 1 3 3 1 1 1 1 0 O 0 0 0 0 0 0 0 0 D 0 0 4 5 4 3 4 3 1 1 1 1 0 1 0 1 1 1 1 1 1 1 4 1 3 3 3 3 3 3 1 1 1 4 4 4 6 6 7 1 1 1 1 1 4. Construct a 95% confidence interval of the difference in population average house prices between houses with a basement (BASEMENT = 1) and houses without a basement (BASEMENT = 0). Assume variance are equal. Interpret the confidence interval. You have to show all the work in order to earn full credit. (5 points) Step by Step Solution
There are 3 Steps involved in it
Step: 1

Get Instant Access to Expert-Tailored Solutions
See step-by-step solutions with expert insights and AI powered tools for academic success
Step: 2

Step: 3
Ace Your Homework with AI
Get the answers you need in no time with our AI-driven, step-by-step assistance
Get Started
The Oxford Handbook Of Private Equity
Authors: Douglas Cumming
1st Edition
0195391586, 978-0195391589