

*please show work
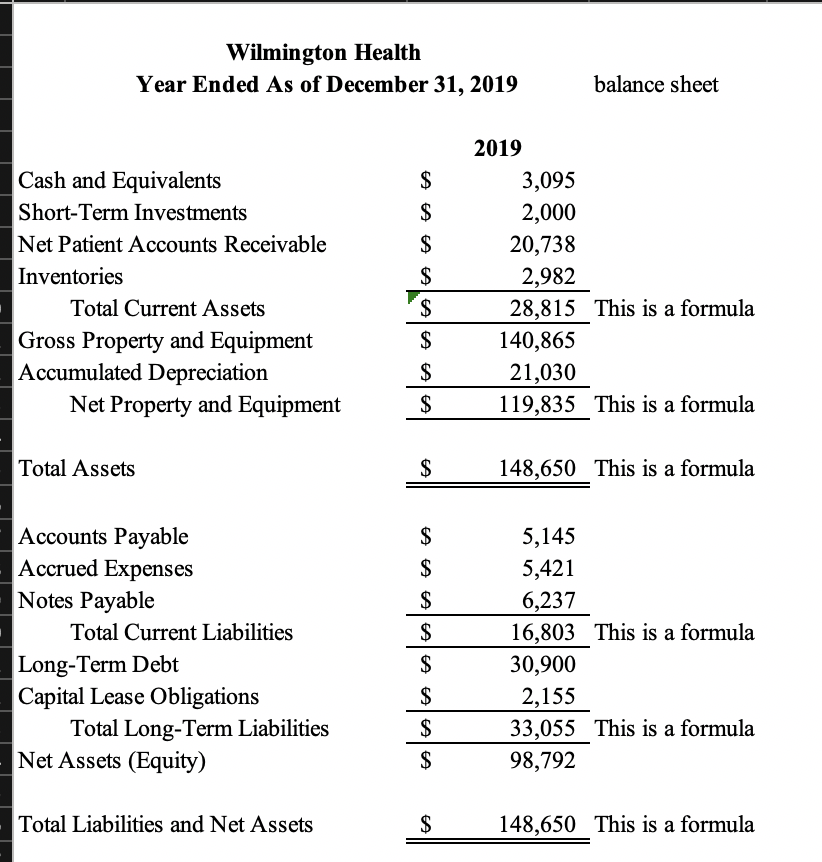
- What is the Debt Ratio for Wilmington Health in 2019?
(If you had a problem, with this, remember that Total Debt is the sum of Total Current Liabilities and Total Long-Term Liabilities).
- 100%
- 33.5%
C. 0.0%
D. 24.2%
- What is the Debt to Equity Ratio for Wilmington Health in 2019?
(If you had a problem, with this, remember that Total Debt is the sum of Total Current Liabilities and Total Long-Term Liabilities).
- 50.5 %
- 61.2 %
- 30.0 %
- 25.8 %
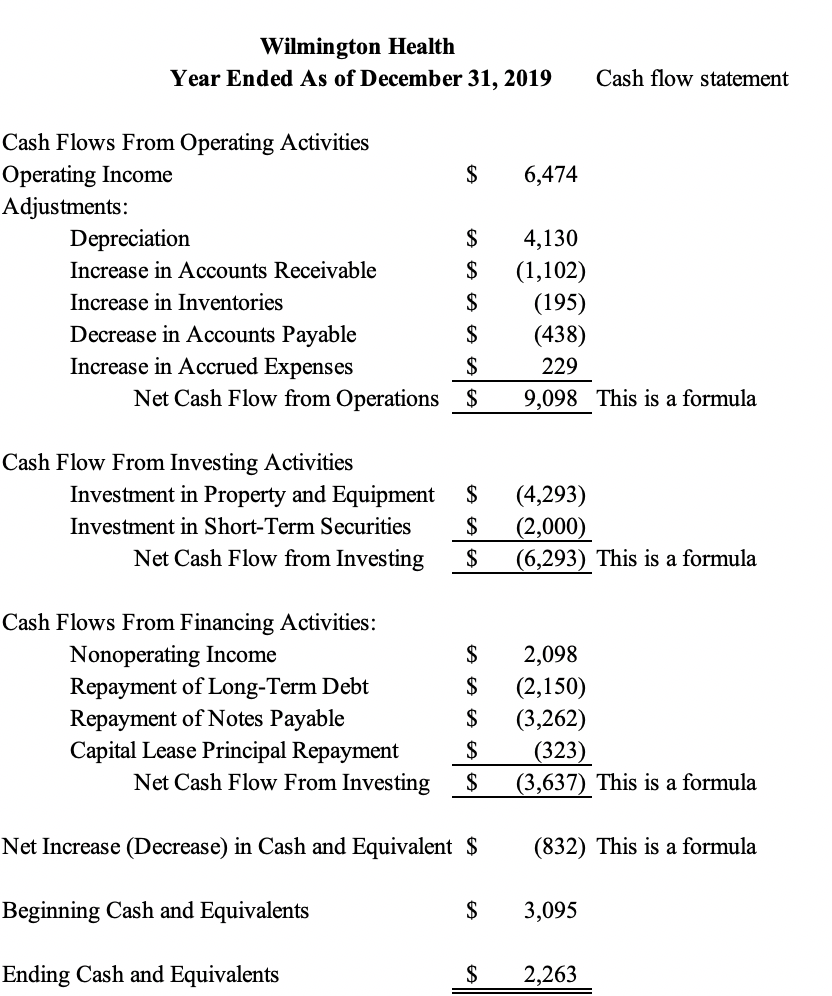
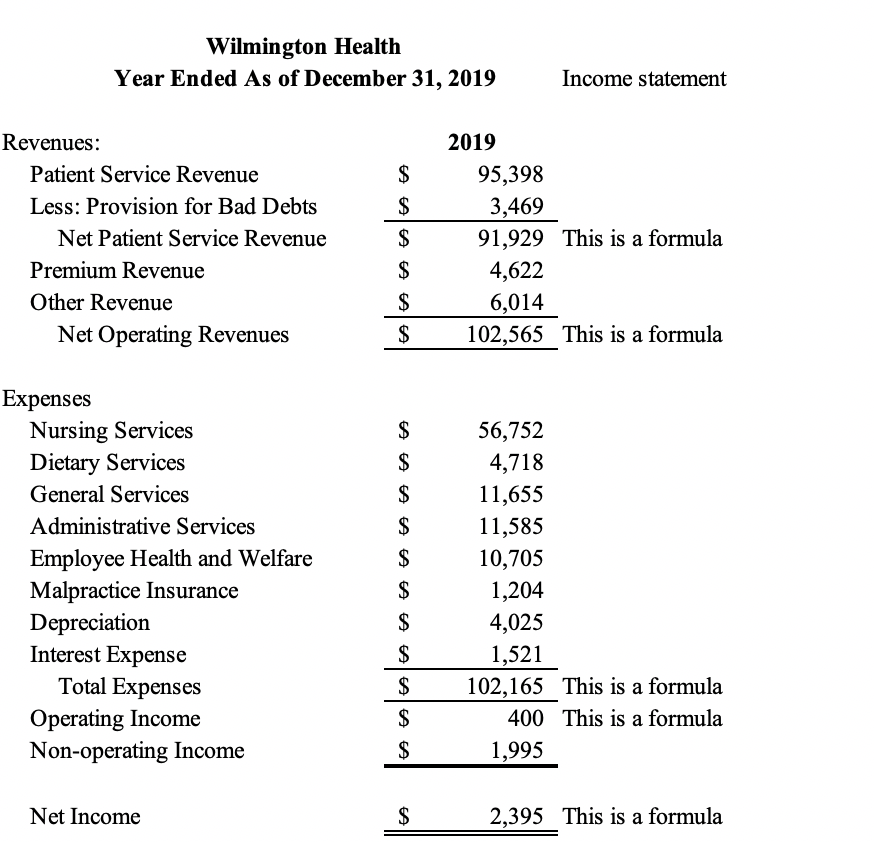
- What is the Times Interest Earned Ratio for Wilmington Health in 2019?
(If you had a problem with this, it is important to remember EBIT is Earnings before Interest and Taxes. This means that you must add Interest and Taxes back into the Net Income number.)
- 8.4 times
- 1.0 times
- 5.1 times
- 2.6 times
- What are the Fixed Assets Turnover Ratio for Wilmington Health in 2019?
(This problem was a little tricky. For this problem, you had to first calculate the Total Revenues.)
- 0.51 times
- 0.87 times
- 1.00 times
- 0.33 times
Wilmington Health Year Ended As of December 31, 2019 Cash flow statement 6,474 Cash Flows From Operating Activities Operating Income $ Adjustments: Depreciation $ Increase in Accounts Receivable $ Increase in Inventories $ Decrease in Accounts Payable $ Increase in Accrued Expenses $ Net Cash Flow from Operations $ 4,130 (1,102) (195) (438) 229 9,098 This is a formula $ Cash Flow From Investing Activities Investment in Property and Equipment Investment in Short-Term Securities Net Cash Flow from Investing $ (4,293) (2,000) (6,293) This is a formula $ $ Cash Flows From Financing Activities: Nonoperating Income Repayment of Long-Term Debt Repayment of Notes Payable Capital Lease Principal Repayment Net Cash Flow From Investing $ $ 2,098 (2,150) (3,262) (323) (3,637) This is a formula $ $ Net Increase (Decrease) in Cash and Equivalent $ (832) This is a formula Beginning Cash and Equivalents $ 3,095 Ending Cash and Equivalents $ 2,263 Wilmington Health Year Ended As of December 31, 2019 Income statement $ $ Revenues: Patient Service Revenue Less: Provision for Bad Debts Net Patient Service Revenue Premium Revenue Other Revenue Net Operating Revenues 2019 95,398 3,469 91,929 This is a formula 4,622 6,014 102,565 This is a formula $ $ $ $ $ $ $ $ Expenses Nursing Services Dietary Services General Services Administrative Services Employee Health and Welfare Malpractice Insurance Depreciation Interest Expense Total Expenses Operating Income Non-operating Income A A A A 56,752 4,718 11,655 11,585 10,705 1,204 4,025 1,521 102,165 This is a formula 400 This is a formula 1,995 $ $ $ $ Net Income $ FA 2,395 This is a formula Wilmington Health Year Ended As of December 31, 2019 balance sheet Cash and Equivalents Short-Term Investments Net Patient Accounts Receivable Inventories Total Current Assets Gross Property and Equipment Accumulated Depreciation Net Property and Equipment A A A A A A $ 2019 3,095 2,000 20,738 2,982 28,815 This is a formula 140,865 21,030 119,835 This is a formula $ Total Assets $ 148,650 This is a formula $ Accounts Payable Accrued Expenses Notes Payable Total Current Liabilities Long-Term Debt Capital Lease Obligations Total Long-Term Liabilities Net Assets (Equity) A A A A A A 5,145 5,421 6,237 16,803 This is a formula 30,900 2,155 33,055 This is a formula 98,792 $ Total Liabilities and Net Assets $ 148,650 This is a formula


