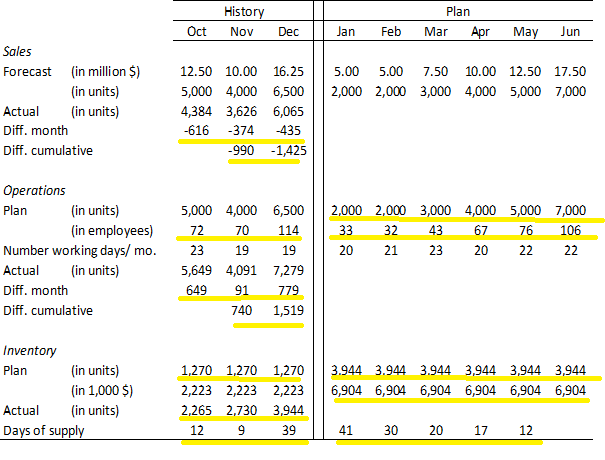
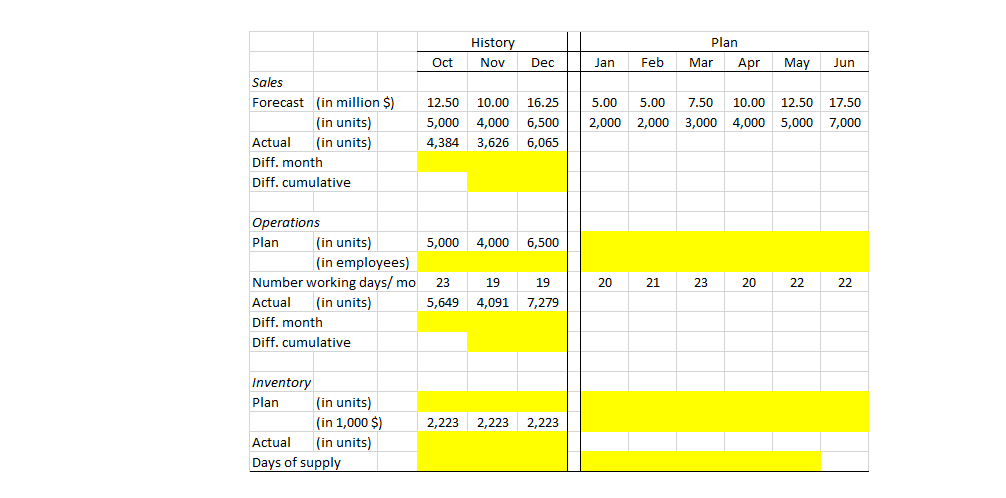
Please show your work in the yellow cells (i.e., show how the numbers displayed in the left table were calculated). Ignore questions a and b. Trapper Lawn Equipment Co. Sales and Operations Planning Spreadsheet: Riding Mowers Product Group (Make-To-Stock)


History Nov Plan Mar Apr Oct Dec Jan Feb May Jun Sales Forecast (in million $) (in units) Actual (in units) Diff. month Diff. cumulative 5.00 5.00 7.50 10.00 12.50 17.50 2,000 2,000 3,000 4,000 5,000 7,000 12.50 10.00 16.25 5,000 4,000 6,500 4,384 3,626 6,065 -616 -374 -435 -990 -1,425 Operations Plan (in units) (in employees) Number working days/ mo. Actual (in units) Diff. month Diff. cumulative 2,000 2,000 3,000 4,000 5,000 7,000 33 32 43 67 76 106 20 21 23 20 22 22 5,000 4,000 6,500 72 70 114 23 19 19 5,649 4,091 7,279 649 91 779 1,519 740 Inventory Plan (in units) (in 1,000 $) Actual (in units) Days of supply 3.944 3.944 3.944 3,944 3,944 3,944 6,904 6,904 6,904 6,904 6,904 6,904 1,270 1,270 1,270 2,223 2,223 2,223 2,265 2,730 3,944 12 9 39 41 30 20 17 12 History Nov Plan Mar Apr Oct Dec Jan Feb May Jun Sales Forecast (in million $) (in units) Actual (in units) Diff. month Diff. cumulative 12.50 10.00 16.25 5,000 4,000 6,500 4,384 3,626 6,065 5.00 5.00 7.50 10.00 12.50 17.50 2,000 2,000 3,000 4,000 5,000 7,000 5,000 4,000 6,500 Operations Plan (in units) (in employees) Number working days/ mo Actual (in units) Diff. month Diff. cumulative 20 21 23 20 22 22 23 19 19 5,649 4,091 7,279 Inventory Plan in units) (in 1,000 $) Actual (in units) Days of supply 2,223 2,223 2,223 History Nov Plan Mar Apr Oct Dec Jan Feb May Jun Sales Forecast (in million $) (in units) Actual (in units) Diff. month Diff. cumulative 5.00 5.00 7.50 10.00 12.50 17.50 2,000 2,000 3,000 4,000 5,000 7,000 12.50 10.00 16.25 5,000 4,000 6,500 4,384 3,626 6,065 -616 -374 -435 -990 -1,425 Operations Plan (in units) (in employees) Number working days/ mo. Actual (in units) Diff. month Diff. cumulative 2,000 2,000 3,000 4,000 5,000 7,000 33 32 43 67 76 106 20 21 23 20 22 22 5,000 4,000 6,500 72 70 114 23 19 19 5,649 4,091 7,279 649 91 779 1,519 740 Inventory Plan (in units) (in 1,000 $) Actual (in units) Days of supply 3.944 3.944 3.944 3,944 3,944 3,944 6,904 6,904 6,904 6,904 6,904 6,904 1,270 1,270 1,270 2,223 2,223 2,223 2,265 2,730 3,944 12 9 39 41 30 20 17 12 History Nov Plan Mar Apr Oct Dec Jan Feb May Jun Sales Forecast (in million $) (in units) Actual (in units) Diff. month Diff. cumulative 12.50 10.00 16.25 5,000 4,000 6,500 4,384 3,626 6,065 5.00 5.00 7.50 10.00 12.50 17.50 2,000 2,000 3,000 4,000 5,000 7,000 5,000 4,000 6,500 Operations Plan (in units) (in employees) Number working days/ mo Actual (in units) Diff. month Diff. cumulative 20 21 23 20 22 22 23 19 19 5,649 4,091 7,279 Inventory Plan in units) (in 1,000 $) Actual (in units) Days of supply 2,223 2,223 2,223


