Please Solve fast:-
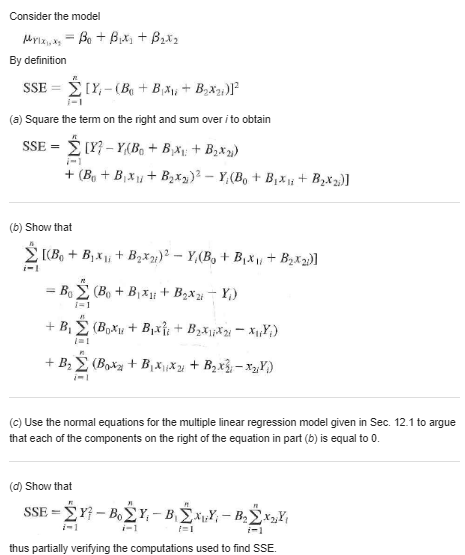
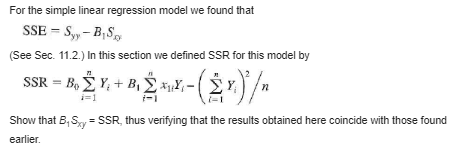
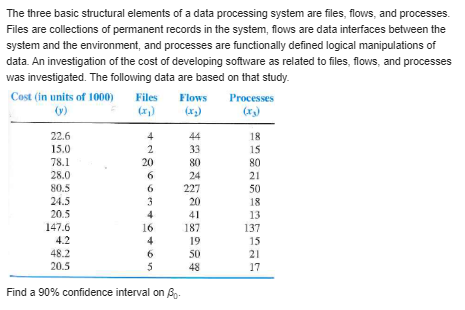
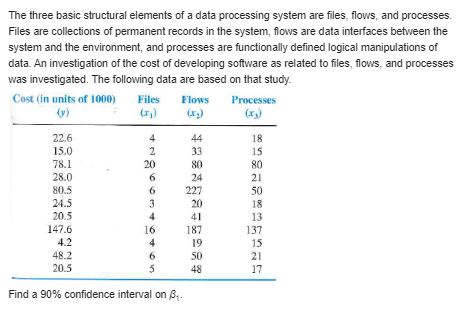
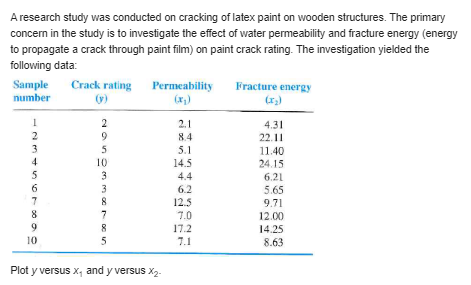
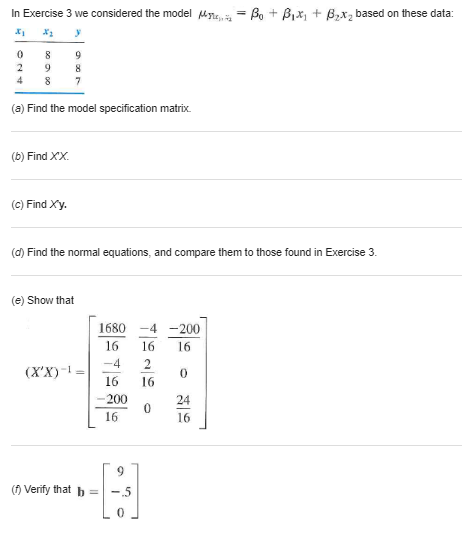
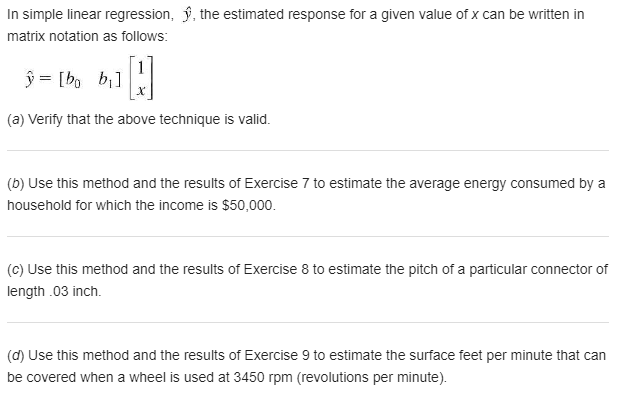
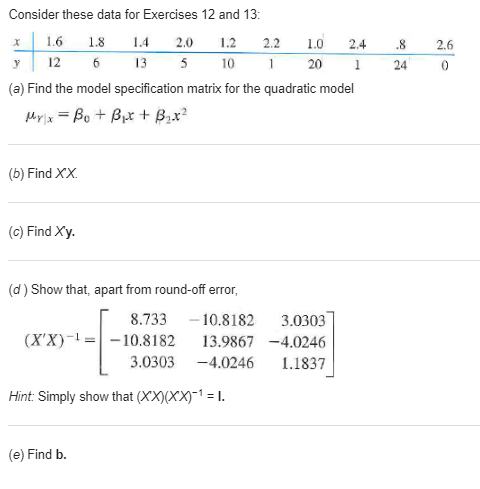
Consider the simple linear regression model. Are 8, and B, uncorrelated? Explain, based on the variance-covariance matrix.Consider the model Mrinix = Bot Bit+ B2x2 By definition SSE = ELY, -(Ba + Bix,; + Box27)]2 (a) Square the term on the right and sum over i to obtain SSE = >[Y? - Y(Bo + BX + B2x2) + (Bu + B,xy + Byx2)2- Y,(Bo + Bix + B2x2)] (b) Show that _ [(Bo + Bjxu + Boxy;)2 - Y,(By + Bix, + Byx2)] = Bo (Bo + Bixni + Boxy + Y) + BE ( Boxy + Bx xy + B2x] -x21) (c) Use the normal equations for the multiple linear regression model given in Sec. 12.1 to argue that each of the components on the right of the equation in part (b) is equal to 0. (d) Show that SSE = EY7 - Bo EY, - B Ex Y, - B, ExLY i-1 thus partially verifying the computations used to find SSE.For the simple linear regression model we found that SSE = Sy - BS (See Sec. 11.2. ) In this section we defined SSR for this model by SSR = B Y, + B, S i=1 - Show that B. S= SSR, thus verifying that the results obtained here coincide with those found earlier.The three basic structural elements of a data processing system are files, flows, and processes. Files are collections of permanent records in the system, flows are data interfaces between the system and the environment, and processes are functionally defined logical manipulations of data. An investigation of the cost of developing software as related to files, flows, and processes was investigated. The following data are based on that study. Cost (in units of 1000) Files Flows Processes ( v) 22.6 44 18 15.0 33 15 78.1 80 80 28.0 24 21 80.5 227 50 24.5 20 18 20.5 41 13 147.6 187 137 4.2 19 15 48.2 50 21 20.5 48 17 Find a 90% confidence interval on Ap.The three basic structural elements of a data processing system are files, flows, and processes. Files are collections of permanent records in the system, flows are data interfaces between the system and the environment, and processes are functionally defined logical manipulations of data. An investigation of the cost of developing software as related to files, flows, and processes was investigated. The following data are based on that study. Cost (in units of 1000) Files Flows Processes (v) (r , ) (x]) 22.6 44 18 15.0 2 33 15 78.1 80 80 28.0 24 21 80.5 227 50 24.5 20 18 20.5 41 13 147.6 187 137 4.2 19 15 48.2 50 21 20.5 48 17 Find a 90% confidence interval on B.Consider the following data: 2 3 4 5 6 7 17 29 34 46 42 52 Using the regression curve selected from Exercise 40, compute a 95% confidence interval on Pyx, when x = 4.8.Consider the following data: 2 5 6 17 29 34 46 42 52 Using the regression curve selected from Exercise 40, compute a 95% prediction interval on an individual response when x = 4.8.A research study was conducted on cracking of latex paint on wooden structures. The primary concern in the study is to investigate the effect of water permeability and fracture energy (energy to propagate a crack through paint film) on paint crack rating. The investigation yielded the following data: Sample Crack rating Permeability Fracture energy number (F) (I, ) 2.1 4.31 84 22.11 5.1 11:40 14.5 24.15 44 6.21 6.2 5.65 125 9.71 T.O 12.00 17.2 14.25 7.1 8.63 Plot y versus x, and y versus X2-Consider the model = Bot Bix + Brixi + B2x2 Express this model in the general linear form of (12.1).In Exercise 3 we considered the model Anna = Bo + Box, + Box; based on these data: 00 10 (a) Find the model specification matrix. (b) Find XX. (c) Find Xy. (d) Find the normal equations, and compare them to those found in Exercise 3. (e) Show that 1680 -4 -200 16 16 16 (XX)= -4 2 0 16 16 -200 0 24 16 16 9 (f) Verify that h = -5 0In simple linear regression, j}, the estimated response for a given value of x can be written in matrix notation as follows: 3r= [ha is] [i] {a} 'v'erifv that the above technique is valid. rs} Use this method and the results of Exercise 7" to estimate the ave rage energy.r consumed by a household for which the inoome is $5D,_ to} Use this method and the results of Exercise 8 to estimate the pitch of a particular oonnector of length .133 inch. {d} Use this method and the results of Exercise 3 to estimate the surface feet per minute that can be covered when a wheel is used at 3450 rpm {revolutions per minute}. In developing a simple linear regression model for predicting gasoline mileage, based on the weight of the car, these data are available: 1.35 1.90 1.70 1.80 1.30 2.05 1.60 1.80 1.85 1.40 17.9 16.5 16.4 16.8 18.8 15.5 17.5 16.4 15.9 18.3 (a) Find the model specification matrix. (b) Find XX. (c) Find Xy. () Find the normal equations via matrix algebra. (e) Find (XX)-1. (f) Find the least-squares estimates for Bo and B, by using matrix algebra. Compare these to the values found in Example 11.3.3. Example 11.3.3. An investigation is conducted to study gasoline mileage in auto- mobiles when used exclusively for urban driving. Ten properly tuned and serviced automobiles manufactured during the same year are used in the study. Each automo- bile is driven for 1000 miles, and the average number of miles per gallon (mi/gal) ob- tained (Y) and the weight of the car in tons (X) are recorded. These data result: Car number 10 Miles per gallon (y) 17.9 16.5 16.4 16.8 13.8 15.5 17.5 16.4 15.9 18.3 Weight in tons (x) 1.35 1.90 1.70 1.80 1.30 2.05 1.60 1.80 1.85 1.40 Summary statistics for these data are n = 10 Ex2 = 28.6375 Ey? = 2900.46 S. = 581 Spy = -2.345 Ex = 16.75 Ey = 170.0 Exy = 282.405 Spy = 10.46 B1 =b = nExy - ExEy nEx - (Ex) 10(282.405) - (16.75) (170.0) 10(28.6375) - (16.75) = -4.03 Bo = bo = y-b,i = 17.0 - (-4.03) (1.675) =23.75 The estimated line of regression is Myix = bo + bix = 23.75 - 4.03x The reader can verify that Ho: B, = 0 can be rejected with P

