

Question
Please solve the questions in blue blanks in Exhibit 3 and explain step by step. [1] Over the past year, Horniman Horticulture had experienced a
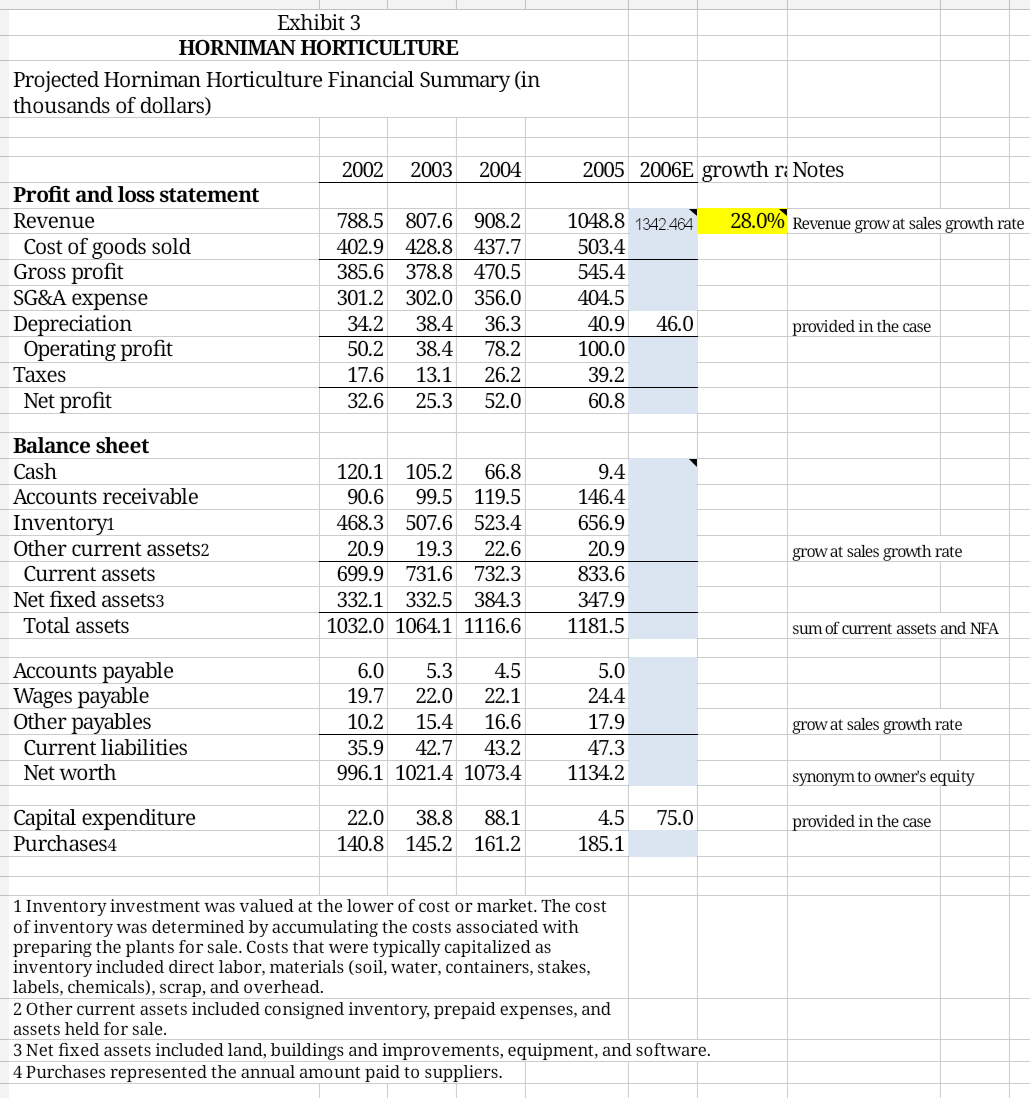
Please solve the questions in blue blanks in Exhibit 3 and explain step by step.
[1] Over the past year, Horniman Horticulture had experienced a noticeable increase in business from small nurseries. Because the cost of carrying inventory was particularly burdensome for those customers, slight improvements in the credit terms had been accompanied by substantial increases in sales. [2] Most of Horniman's suppliers provided 30-day payment terms, with a 2% discount for payments received within 10 days. [3] As compensation for the Browns' services to the business, they had drawn an annual salary of $50,000 (itemized as an SG&A expense) for each of the past three years. This amount was effectively the family's entire income. [4] With the acquisition of the additional property, Maggie expected 2006 capital expenditures to be $75,000. Although she was not planning to finance the purchase, prevailing mortgage rates were running at 6.5%. The expected depreciation expense for 2006 was $46,000.
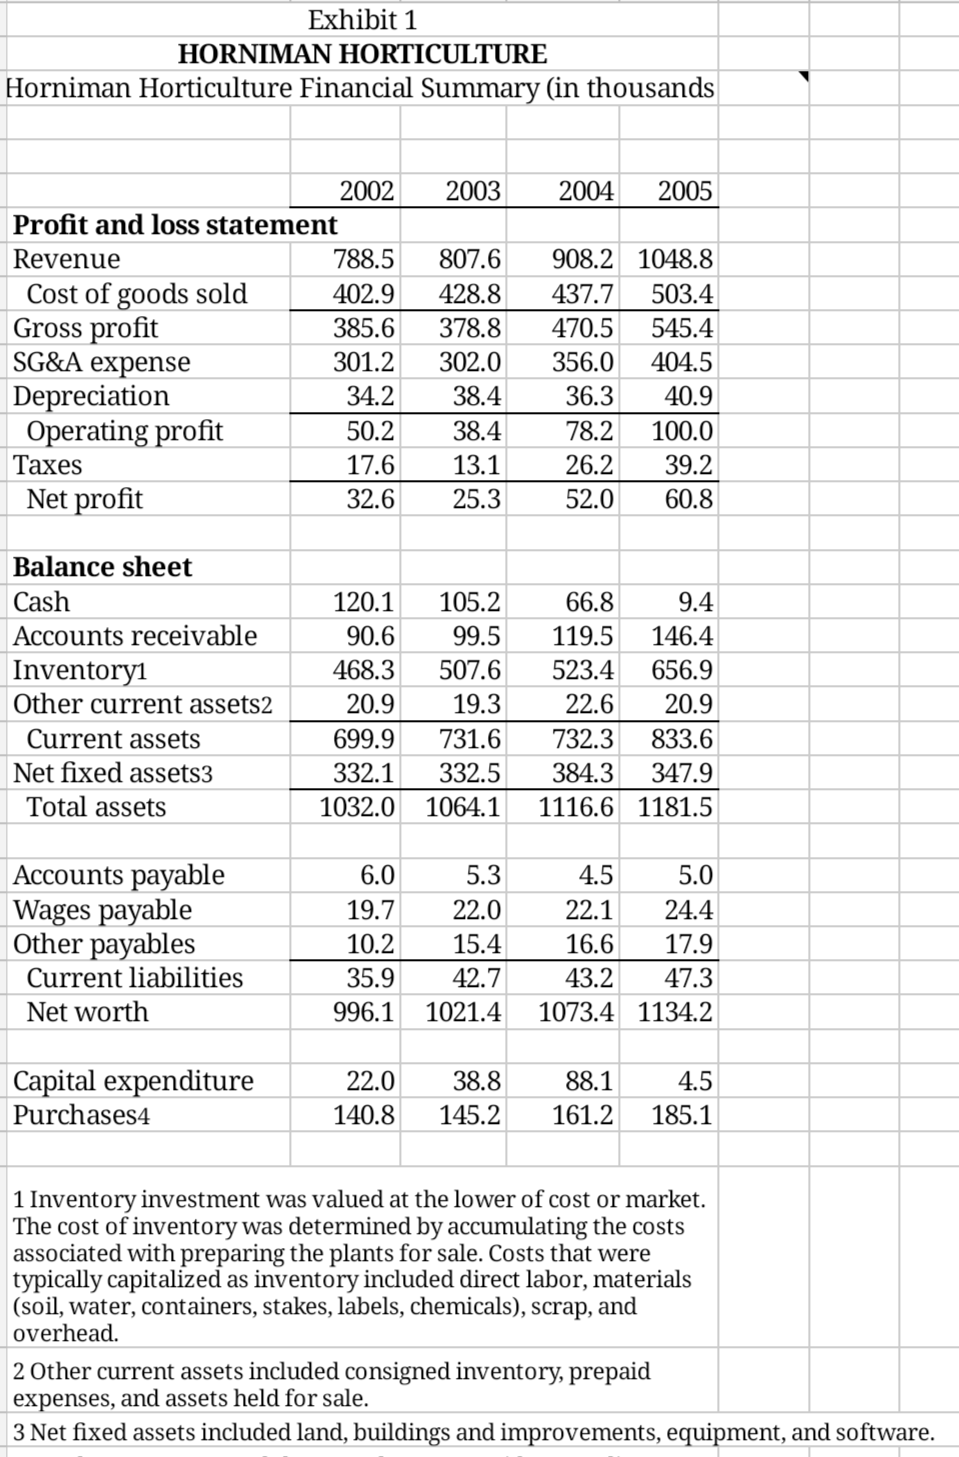
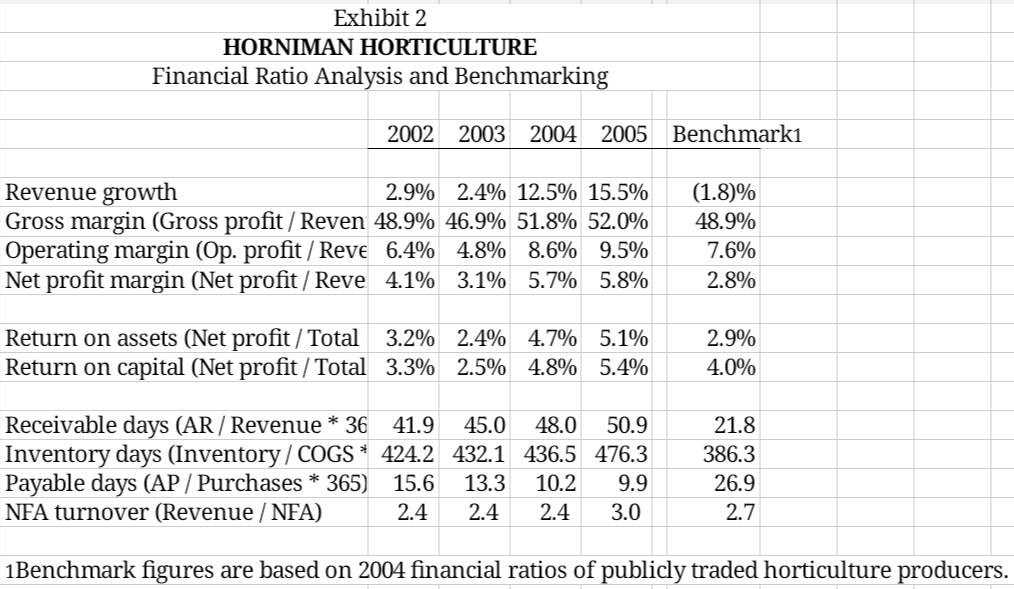
Exhibit 1 HORNIMAN HORTICULTURE Horniman Horticulture Financial Summary (in thousands 2003 2004 2005 2002 Profit and loss statement Revenue 788.5 Cost of goods sold 402.9 Gross profit 385.6 SG&A expense 301.2 Depreciation 34.2 Operating profit 50.2 Taxes 17.6 Net profit 32.6 807.6 428.8 378.8 302.0 38.4 38.4 13.1 25.3 908.2 1048.8 437.7 503.4 470.5 545.4 356.0 404.5 36.3 40.9 78.2 100.0 26.2 39.2 52.0 60.8 Balance sheet Cash Accounts receivable Inventory1 Other current assets2 Current assets Net fixed assets3 Total assets 120.1 90.6 468.3 20.9 699.9 332.1 1032.0 105.2 99.5 507.6 19.3 731.6 332.5 1064.1 66.8 9.4 119.5 146.4 523.4 656.9 22.6 20.9 732.3 833.6 384.3 347.9 1116.6 1181.5 AO unts payable Wages payable Other payables Current liabilities Net worth 19.7 10.2 35.9 996.1 5.3 22.0 15.4 42.7 1021.4 4.5 5.( 22.1 24.4 16.6 17.9 43.2 47.3 1073.4 1134.2 Capital expenditure Purchases4 22.0 140.8 38.8 145.2 88.1 161.2 4.5 185.1 1 Inventory investment was valued at the lower of cost or market. The cost of inventory was determined by accumulating the costs associated with preparing the plants for sale. Costs that were typically capitalized as inventory included direct labor, materials (soil, water, containers, stakes, labels, chemicals), scrap, and overhead. 2 Other current assets included consigned inventory, prepaid expenses, and assets held for sale. 3 Net fixed assets included land, buildings and improvements, equipment, and software. Exhibit 2 HORNIMAN HORTICULTURE Financial Ratio Analysis and Benchmarking 2002 2003 2004 2005 Benchmarki Revenue growth 2.9% 2.4% 12.5% 15.5% Gross margin (Gross profit / Reven 48.9% 46.9% 51.8% 52.0% Operating margin (Op. profit / Reve 6.4% 4.8% 8.6% 9.5% Net profit margin (Net profit / Reve 4.1% 3.1% 5.7% 5.8% (1.8)% 48.9% 7.6% 2.8% Return on assets (Net profit/ Total 3.2% 2.4% 4.7% 5.1% Return on capital (Net profit/Total 3.3% 2.5% 4.8% 5.4% 2.9% 4.0% Receivable days (AR / Revenue * 36 41.9 45.0 48.0 50.9 Inventory days (Inventory/ COGS * 424.2 432.1 436.5 476.3 Payable days (AP / Purchases * 365) 15.6 13.3 10.2 9.9 NFA turnover (Revenue/NFA) 2.4 2.4 2.4 3.0 21.8 386.3 26.9 2.7 1Benchmark figures are based on 2004 financial ratios of publicly traded horticulture producers. Exhibit 3 HORNIMAN HORTICULTURE Projected Horniman Horticulture Financial Summary (in thousands of dollars) 2002 2003 2004 2005 2006E growth r: Notes 28.0% Revenue grow at sales growth rate Profit and loss statement Revenue Cost of goods sold Gross profit SG&A expense Depreciation Operating profit Taxes Net profit 788.5 807.6 908.2 402.9 428.8 437.7 385.6 378.8 470.5 301.2 302.0 356.0 34.2 38.4 36.3 50.2 38.4 78.2 17.6 13.1 26.2 32.6 25.3 52.0 1048.8 1342.464 503.4 545.4 404.5 40.9 46.0 100.0 39.2 60.8 provided in the case Balance sheet Cash Accounts receivable Inventoryi Other current assets2 Current assets Net fixed assets3 Total assets 120.1 105.2 66.8 90.6 99.5 119.5 468.3 507.6 523.4 20.9 19.3 22.6 699.9 731.6 732.3 332.1 332.5 384.3 1032.0 1064.1 1116.6 9.4 146.4 656.9 20.9 833.6 347.9 1181.5 grow at sales growth rate sum of current assets and NFA Accounts payable Wages payable Other payables Current liabilities Net worth 6.0 5.3 4.5 19.7 22.0 22.1 10.2 15.4 16.6 35.9 42.7 43.2 996.1 1021.4 1073.4 5.0 24.4 17.9 47.3 1134.2 grow at sales growth rate synonym to owner's equity 75.0 Capital expenditure Purchases4 22.0 140.8 38.8 88.1 145.2 161.2 provided in the case 4.5 185.1 1 Inventory investment was valued at the lower of cost or market. The cost of inventory was determined by accumulating the costs associated with preparing the plants for sale. Costs that were typically capitalized as inventory included direct labor, materials (soil, water, containers, stakes, labels, chemicals), scrap, and overhead. 2 Other current assets included consigned inventory, prepaid expenses, and assets held for sale. 3 Net fixed assets included land, buildings and improvements, equipment, and software. 4 Purchases represented the annual amount paid to suppliers. Exhibit 1 HORNIMAN HORTICULTURE Horniman Horticulture Financial Summary (in thousands 2003 2004 2005 2002 Profit and loss statement Revenue 788.5 Cost of goods sold 402.9 Gross profit 385.6 SG&A expense 301.2 Depreciation 34.2 Operating profit 50.2 Taxes 17.6 Net profit 32.6 807.6 428.8 378.8 302.0 38.4 38.4 13.1 25.3 908.2 1048.8 437.7 503.4 470.5 545.4 356.0 404.5 36.3 40.9 78.2 100.0 26.2 39.2 52.0 60.8 Balance sheet Cash Accounts receivable Inventory1 Other current assets2 Current assets Net fixed assets3 Total assets 120.1 90.6 468.3 20.9 699.9 332.1 1032.0 105.2 99.5 507.6 19.3 731.6 332.5 1064.1 66.8 9.4 119.5 146.4 523.4 656.9 22.6 20.9 732.3 833.6 384.3 347.9 1116.6 1181.5 AO unts payable Wages payable Other payables Current liabilities Net worth 19.7 10.2 35.9 996.1 5.3 22.0 15.4 42.7 1021.4 4.5 5.( 22.1 24.4 16.6 17.9 43.2 47.3 1073.4 1134.2 Capital expenditure Purchases4 22.0 140.8 38.8 145.2 88.1 161.2 4.5 185.1 1 Inventory investment was valued at the lower of cost or market. The cost of inventory was determined by accumulating the costs associated with preparing the plants for sale. Costs that were typically capitalized as inventory included direct labor, materials (soil, water, containers, stakes, labels, chemicals), scrap, and overhead. 2 Other current assets included consigned inventory, prepaid expenses, and assets held for sale. 3 Net fixed assets included land, buildings and improvements, equipment, and software. Exhibit 2 HORNIMAN HORTICULTURE Financial Ratio Analysis and Benchmarking 2002 2003 2004 2005 Benchmarki Revenue growth 2.9% 2.4% 12.5% 15.5% Gross margin (Gross profit / Reven 48.9% 46.9% 51.8% 52.0% Operating margin (Op. profit / Reve 6.4% 4.8% 8.6% 9.5% Net profit margin (Net profit / Reve 4.1% 3.1% 5.7% 5.8% (1.8)% 48.9% 7.6% 2.8% Return on assets (Net profit/ Total 3.2% 2.4% 4.7% 5.1% Return on capital (Net profit/Total 3.3% 2.5% 4.8% 5.4% 2.9% 4.0% Receivable days (AR / Revenue * 36 41.9 45.0 48.0 50.9 Inventory days (Inventory/ COGS * 424.2 432.1 436.5 476.3 Payable days (AP / Purchases * 365) 15.6 13.3 10.2 9.9 NFA turnover (Revenue/NFA) 2.4 2.4 2.4 3.0 21.8 386.3 26.9 2.7 1Benchmark figures are based on 2004 financial ratios of publicly traded horticulture producers. Exhibit 3 HORNIMAN HORTICULTURE Projected Horniman Horticulture Financial Summary (in thousands of dollars) 2002 2003 2004 2005 2006E growth r: Notes 28.0% Revenue grow at sales growth rate Profit and loss statement Revenue Cost of goods sold Gross profit SG&A expense Depreciation Operating profit Taxes Net profit 788.5 807.6 908.2 402.9 428.8 437.7 385.6 378.8 470.5 301.2 302.0 356.0 34.2 38.4 36.3 50.2 38.4 78.2 17.6 13.1 26.2 32.6 25.3 52.0 1048.8 1342.464 503.4 545.4 404.5 40.9 46.0 100.0 39.2 60.8 provided in the case Balance sheet Cash Accounts receivable Inventoryi Other current assets2 Current assets Net fixed assets3 Total assets 120.1 105.2 66.8 90.6 99.5 119.5 468.3 507.6 523.4 20.9 19.3 22.6 699.9 731.6 732.3 332.1 332.5 384.3 1032.0 1064.1 1116.6 9.4 146.4 656.9 20.9 833.6 347.9 1181.5 grow at sales growth rate sum of current assets and NFA Accounts payable Wages payable Other payables Current liabilities Net worth 6.0 5.3 4.5 19.7 22.0 22.1 10.2 15.4 16.6 35.9 42.7 43.2 996.1 1021.4 1073.4 5.0 24.4 17.9 47.3 1134.2 grow at sales growth rate synonym to owner's equity 75.0 Capital expenditure Purchases4 22.0 140.8 38.8 88.1 145.2 161.2 provided in the case 4.5 185.1 1 Inventory investment was valued at the lower of cost or market. The cost of inventory was determined by accumulating the costs associated with preparing the plants for sale. Costs that were typically capitalized as inventory included direct labor, materials (soil, water, containers, stakes, labels, chemicals), scrap, and overhead. 2 Other current assets included consigned inventory, prepaid expenses, and assets held for sale. 3 Net fixed assets included land, buildings and improvements, equipment, and software. 4 Purchases represented the annual amount paid to suppliersStep by Step Solution
There are 3 Steps involved in it
Step: 1

Get Instant Access to Expert-Tailored Solutions
See step-by-step solutions with expert insights and AI powered tools for academic success
Step: 2

Step: 3
Ace Your Homework with AI
Get the answers you need in no time with our AI-driven, step-by-step assistance
Get Started
Financial Crimes Psychological Technological And Ethical Issues
Authors: Michel Dion , David Weisstub, Jean-Loup Richet
1st Edition
3319324187,3319324195