PLEASE SOLVE THESE ASAP. JUST SOLVE THE ONES THAT CAN BE WITH THE PROVIDED DATA ASAP:
Gross profit Ratio:
Net Profit margin:
Operating profit ratio:
Operating Ratio:
Operating expense ratio
Cost of Goods sold ratio:
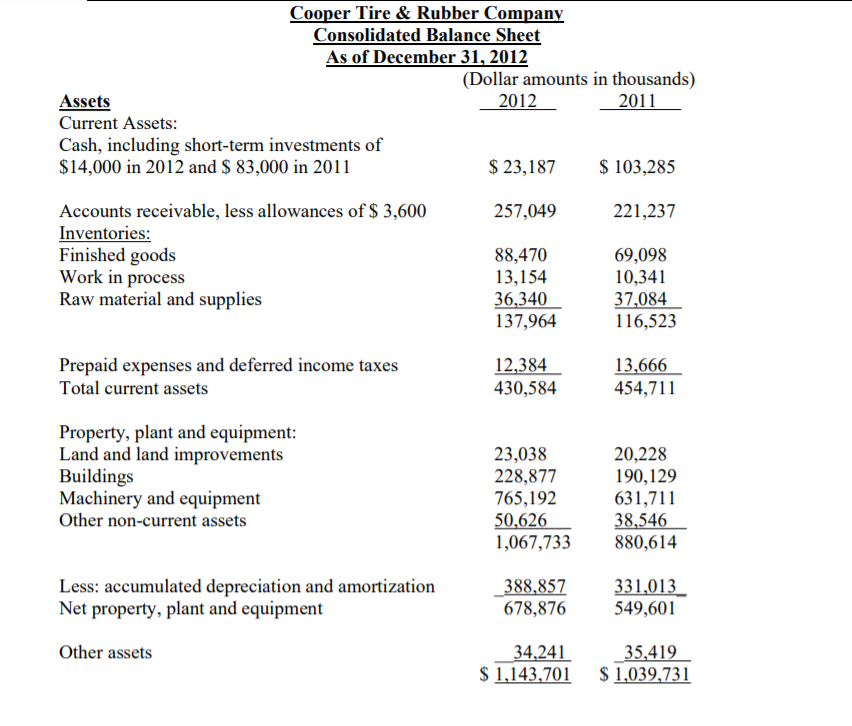
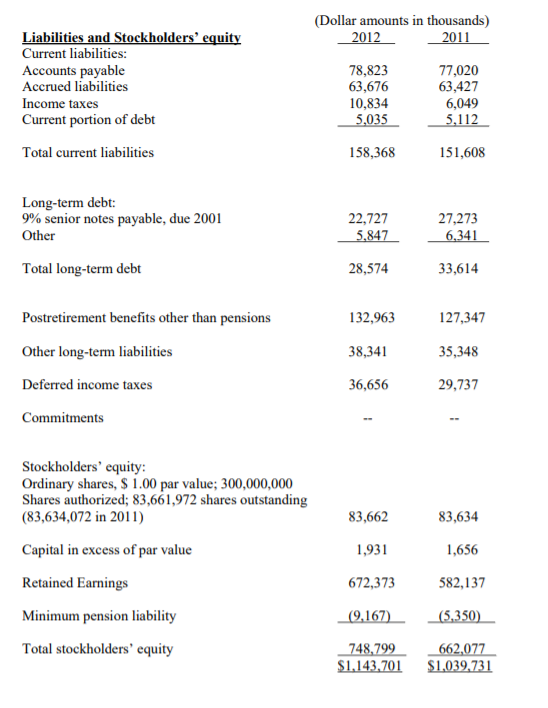
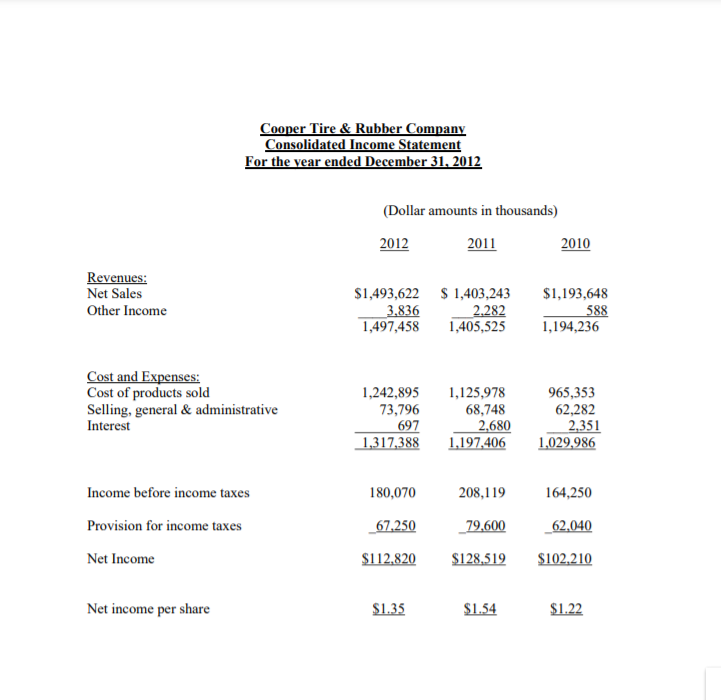
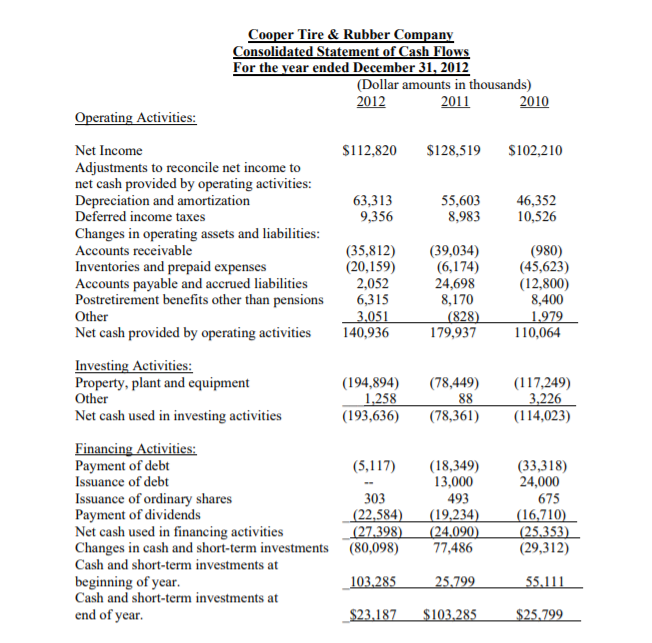
Cooper Tire & Rubber Company Consolidated Balance Sheet As of December 31, 2012 (Dollar amounts in thousands) Assets 2012 2011 Current Assets: Cash, including short-term investments of $14,000 in 2012 and $ 83,000 in 2011 $ 23,187 $ 103,285 257,049 221,237 Accounts receivable, less allowances of $ 3,600 Inventories: Finished goods Work in process Raw material and supplies 88,470 13,154 36,340 137,964 69,098 10,341 37,084 116,523 Prepaid expenses and deferred income taxes Total current assets 12,384 430,584 13,666 454,711 Property, plant and equipment: Land and land improvements Buildings Machinery and equipment Other non-current assets 23,038 228,877 765,192 50,626 1,067,733 20,228 190,129 631,711 38,546 880,614 Less: accumulated depreciation and amortization Net property, plant and equipment 388,857 678,876 331,013 549,601 Other assets 34,241 $ 1,143,701 35,419 $ 1,039,731 (Dollar amounts in thousands) 2012 2011 Liabilities and Stockholders' equity Current liabilities: Accounts payable Accrued liabilities Income taxes Current portion of debt Total current liabilities 78,823 63,676 10,834 5,035 77,020 63,427 6,049 5,112 158,368 151,608 Long-term debt: 9% senior notes payable, due 2001 Other 22,727 5,847 27,273 6,341 Total long-term debt 28,574 33,614 132,963 127,347 38,341 35,348 Postretirement benefits other than pensions Other long-term liabilities Deferred income taxes Commitments 36,656 29,737 83,662 83,634 1,931 Stockholders' equity: Ordinary shares, $ 1.00 par value; 300,000,000 Shares authorized; 83,661,972 shares outstanding (83,634,072 in 2011) Capital in excess of par value Retained Earnings Minimum pension liability Total stockholders' equity 1,656 672,373 582,137 (9,167) (5,350) 748,799 $1,143,701 662,077 $1,039,731 Cooper Tire & Rubber Company Consolidated Income Statement For the year ended December 31, 2012 (Dollar amounts in thousands) 2012 2011 2010 Revenues: Net Sales Other Income $1,493,622 $ 1,403,243 3.836 2.282 1,497,458 1,405,525 $1,193,648 588 1,194,236 Cost and Expenses: Cost of products sold Selling, general & administrative Interest 1,242,895 73,796 697 1,317,388 1,125,978 68,748 2,680 1,197,406 965,353 62,282 2,351 1,029,986 180,070 208,119 164,250 Income before income taxes Provision for income taxes 67.250 79,600 62,040 Net Income $112.820 $128,519 $102,210 Net income per share $1.35 $1.54 $1.22 Cooper Tire & Rubber Company Consolidated Statement of Cash Flows For the year ended December 31, 2012 (Dollar amounts in thousands) 2012 2011 2010 Operating Activities: Net Income $112,820 $128,519 $102,210 Adjustments to reconcile net income to net cash provided by operating activities: Depreciation and amortization 63,313 55,603 46,352 Deferred income taxes 9,356 8,983 10,526 Changes in operating assets and liabilities: Accounts receivable (35,812) (39,034) (980) Inventories and prepaid expenses (20,159) (6,174) (45,623) Accounts payable and accrued liabilities 2,052 24,698 (12,800) Postretirement benefits other than pensions 6,315 8,170 8,400 Other 3,051 (828) 1.979 Net cash provided by operating activities 140,936 179,937 110,064 Investing Activities: Property, plant and equipment (194,894) (78,449) (117,249) Other 1,258 88 3,226 Net cash used in investing activities (193,636) (78,361) (114,023) Financing Activities: Payment of debt (5,117) (18,349) (33,318) Issuance of debt 13,000 24,000 Issuance of ordinary shares 303 493 675 Payment of dividends (22,584) (19,234) (16,710) Net cash used in financing activities (27.398) (24,090) (25.353) Changes in cash and short-term investments (80,098) 77,486 (29,312) Cash and short-term investments at beginning of year. 103,285 25.799 55.111 Cash and short-term investments at end of year. $23,187 $103.285 $25.799


