Answered step by step
Verified Expert Solution
Question
1 Approved Answer
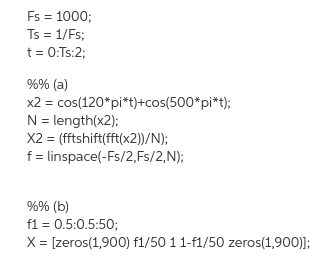
Please solve these questions in MATLAB and please EXPLAIN your code. By the way, Second image is providing information about x, x2 and X, X2.


Please solve these questions in MATLAB and please EXPLAIN your code. By the way, Second image is providing information about x, x2 and X, X2. If you want to more detail, I can provide but I dont think so. Anyway, Thanks in advance. I will give thumb up :)
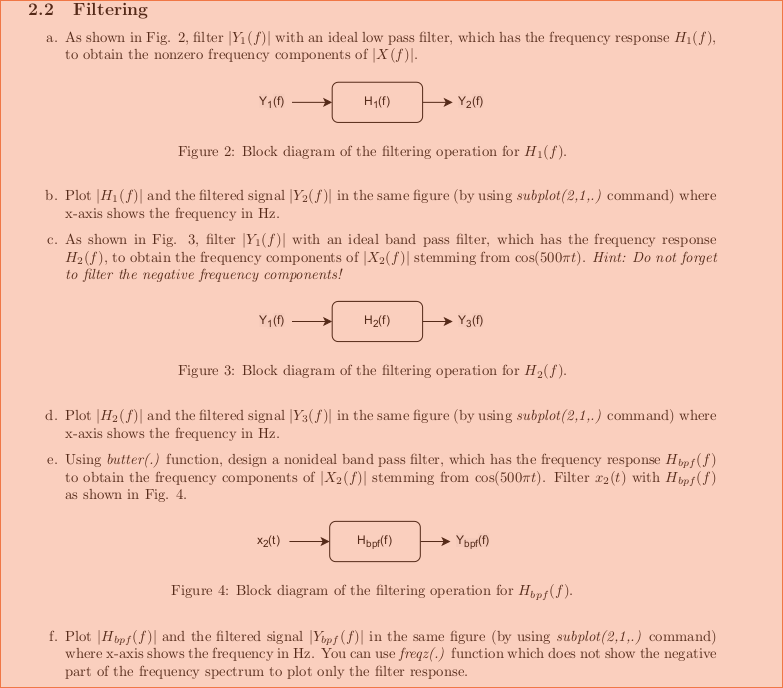
2.2 Filtering a. As shown in Fig. 2, filter Yi (3) with an ideal low pass filter, which has the frequency response H (f), to obtain the nonzero frequency components of X(). Y (6) H (f) Y2(1) Figure 2: Block diagram of the filtering operation for H (1). b. Plot |H () and the filtered signal |Y2() in the same figure (by using subplot(2,1,.) command) where x-axis shows the frequency in Hz. c. As shown in Fig. 3, filter Yi(d) with an ideal band pass filter, which has the frequency response H2), to obtain the frequency components of |X2(1) stemming from cos(500mt). Hint: Do not forget to filter the negative frequency components! Y (6) H2(f) Y3 () Figure 3: Block diagram of the filtering operation for H1). d. Plot |H2() and the filtered signal |Y3() in the same figure (by using subplot(2,1,.) command) where x-axis shows the frequency in Hz. e. Using butter() function, design a nonideal band pass filter, which has the frequency response Hipf (f) to obtain the frequency components of |X2() stemming from cos(500mt). Filter 22(t) with Hopf (1) as shown in Fig. 4. Xz(t) Hopf(f) Ybpf(f) Figure 4: Block diagram of the filtering operation for Hop/). f. Plot Hupf (D) and the filtered signal Yopf ( in the same figure (by using subplot(2,1,c) command) where x-axis shows the frequency in Hz. You can use freqz(.) function which does not show the negative part of the frequency spectrum to plot only the filter response. Fs = 1000; Ts = 1/Fs; t = 0:Ts:2; %% (a) x2 = cos(120*pi*t)+cos(500*pi*t); N = length(x2); X2 = (fftshift(fft(x2))/N); f = linspace(-Fs/2,Fs/2,N); %% (b) f1 = 0.5:0.5:50; X = [zeros(1,900) f1/50 1 1-f1/50 zeros(1,900)); 2.2 Filtering a. As shown in Fig. 2, filter Yi (3) with an ideal low pass filter, which has the frequency response H (f), to obtain the nonzero frequency components of X(). Y (6) H (f) Y2(1) Figure 2: Block diagram of the filtering operation for H (1). b. Plot |H () and the filtered signal |Y2() in the same figure (by using subplot(2,1,.) command) where x-axis shows the frequency in Hz. c. As shown in Fig. 3, filter Yi(d) with an ideal band pass filter, which has the frequency response H2), to obtain the frequency components of |X2(1) stemming from cos(500mt). Hint: Do not forget to filter the negative frequency components! Y (6) H2(f) Y3 () Figure 3: Block diagram of the filtering operation for H1). d. Plot |H2() and the filtered signal |Y3() in the same figure (by using subplot(2,1,.) command) where x-axis shows the frequency in Hz. e. Using butter() function, design a nonideal band pass filter, which has the frequency response Hipf (f) to obtain the frequency components of |X2() stemming from cos(500mt). Filter 22(t) with Hopf (1) as shown in Fig. 4. Xz(t) Hopf(f) Ybpf(f) Figure 4: Block diagram of the filtering operation for Hop/). f. Plot Hupf (D) and the filtered signal Yopf ( in the same figure (by using subplot(2,1,c) command) where x-axis shows the frequency in Hz. You can use freqz(.) function which does not show the negative part of the frequency spectrum to plot only the filter response. Fs = 1000; Ts = 1/Fs; t = 0:Ts:2; %% (a) x2 = cos(120*pi*t)+cos(500*pi*t); N = length(x2); X2 = (fftshift(fft(x2))/N); f = linspace(-Fs/2,Fs/2,N); %% (b) f1 = 0.5:0.5:50; X = [zeros(1,900) f1/50 1 1-f1/50 zeros(1,900))Step by Step Solution
There are 3 Steps involved in it
Step: 1

Get Instant Access to Expert-Tailored Solutions
See step-by-step solutions with expert insights and AI powered tools for academic success
Step: 2

Step: 3

Ace Your Homework with AI
Get the answers you need in no time with our AI-driven, step-by-step assistance
Get Started


