Answered step by step
Verified Expert Solution
Link Copied!

Question

1 Approved Answer

Please solve this question: Suppose we have the following data for an economy: :1) Calculate the output gap for each year in this economy. Note:

Please solve this question:
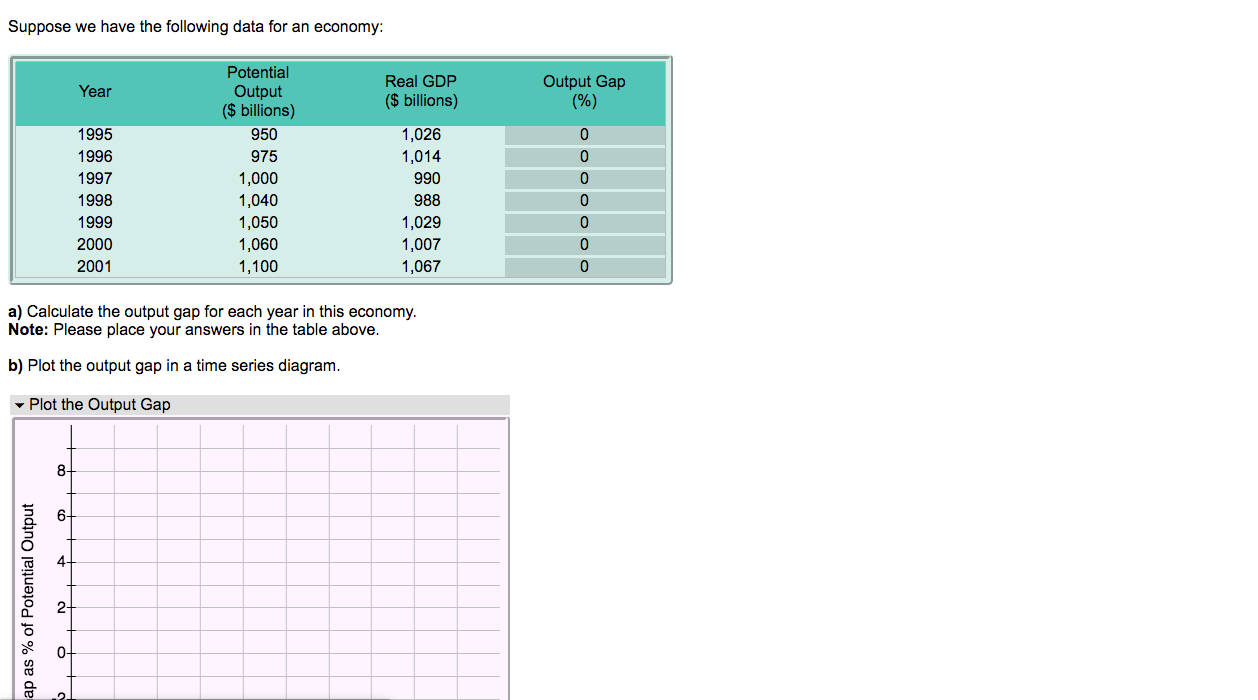
image text in transcribedimage text in transcribed
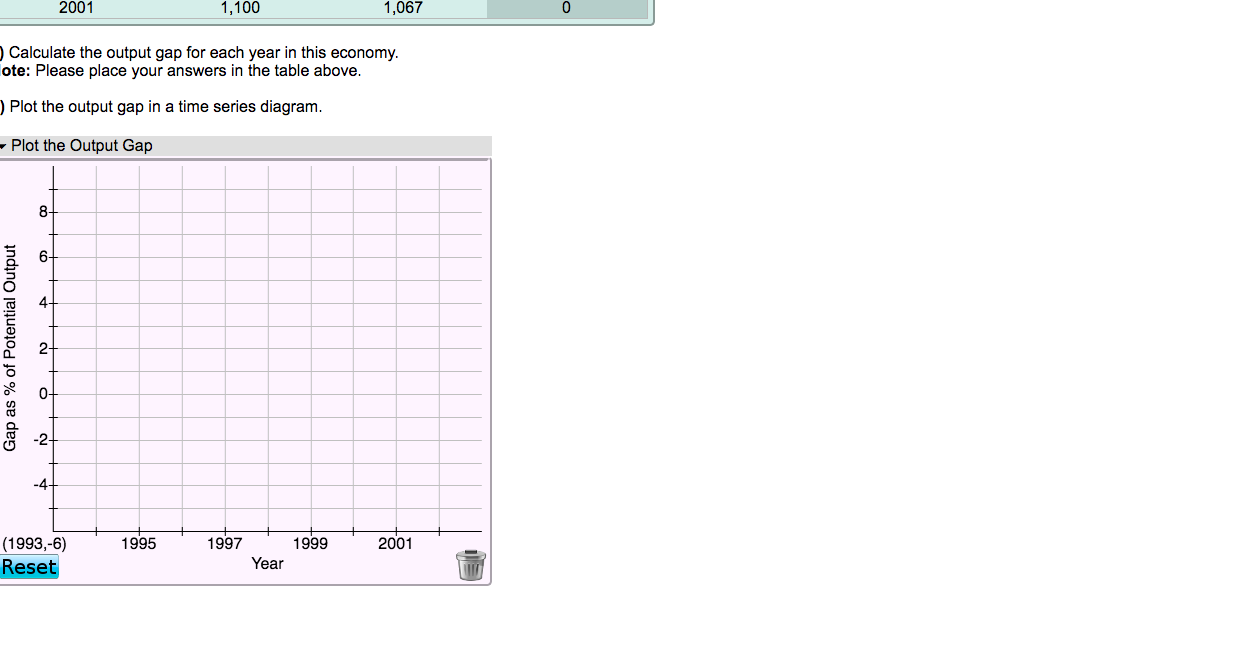
Suppose we have the following data for an economy: :1) Calculate the output gap for each year in this economy. Note: Please place your answers in the table above. b) Plot the output gap in a lime series diagram. vPlloaomputGap ap as % of Potential Output P3 2001 1, 100 1,067 0 Calculate the output gap for each year in this economy. ote: Please place your answers in the table above. ) Plot the output gap in a time series diagram. Plot the Output Gap 8- Gap as % of Potential Output 6- 2- -2- (1993,-6) 1995 1997 1999 2001 Reset Year

Step by Step Solution

There are 3 Steps involved in it

Step: 1

blur-text-image

Get Instant Access to Expert-Tailored Solutions

See step-by-step solutions with expert insights and AI powered tools for academic success

Step: 2

blur-text-image_2

Step: 3

blur-text-image_3

Ace Your Homework with AI

Get the answers you need in no time with our AI-driven, step-by-step assistance

Get Started

Recommended Textbook for

Macroeconomics Principles And Policy

Authors: William J. Baumol, Alan S. Blinder

11th Edition

0324586213, 978-0324586213

More Books

Students also viewed these Economics questions