Answered step by step
Verified Expert Solution
Question
1 Approved Answer
Please solve this using MATLAB Part II: Optimal Quantizer (40 points) Write a MATLAB or C code that implements the GLA. Specifically, design an optimal
Please solve this using MATLAB

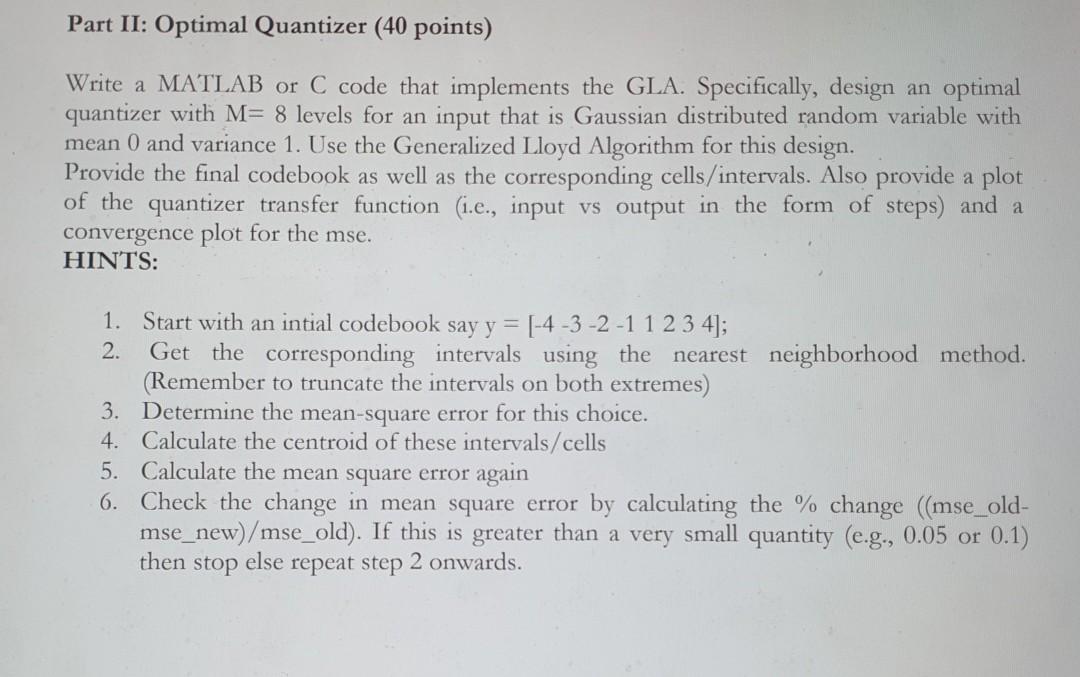
Part II: Optimal Quantizer (40 points) Write a MATLAB or C code that implements the GLA. Specifically, design an optimal quantizer with M= 8 levels for an input that is Gaussian distributed random variable with mean 0 and variance 1. Use the Generalized Lloyd Algorithm for this design. Provide the final codebook as well as the corresponding cells/intervals. Also provide a plot of the quantizer transfer function (i.e., input vs output in the form of steps) and a convergence plot for the mse. HINTS: 1. Start with an intial codebook say y = [-4 -3 -2 -1 1 2 3 4]; 2. Get the corresponding intervals using the nearest neighborhood method. (Remember to truncate the intervals on both extremes) 3. Determine the mean-square error for this choice. 4. Calculate the centroid of these intervals/cells 5. Calculate the mean square error again 6. Check the change in mean square error by calculating the % change (mse_old- mse_new)/mse_old). If this is greater than a very small quantity (e.g., 0.05 or 0.1) then stop else repeat step 2 onwards. Part II: Optimal Quantizer (40 points) Write a MATLAB or C code that implements the GLA. Specifically, design an optimal quantizer with M= 8 levels for an input that is Gaussian distributed random variable with mean 0 and variance 1. Use the Generalized Lloyd Algorithm for this design. Provide the final codebook as well as the corresponding cells/intervals. Also provide a plot of the quantizer transfer function (i.e., input vs output in the form of steps) and a convergence plot for the mse. HINTS: 1. Start with an intial codebook say y = [-4 -3 -2 -1 1 2 3 4]; 2. Get the corresponding intervals using the nearest neighborhood method. (Remember to truncate the intervals on both extremes) 3. Determine the mean-square error for this choice. 4. Calculate the centroid of these intervals/cells 5. Calculate the mean square error again 6. Check the change in mean square error by calculating the % change (mse_old- mse_new)/mse_old). If this is greater than a very small quantity (e.g., 0.05 or 0.1) then stop else repeat step 2 onwards
Step by Step Solution
There are 3 Steps involved in it
Step: 1

Get Instant Access to Expert-Tailored Solutions
See step-by-step solutions with expert insights and AI powered tools for academic success
Step: 2

Step: 3

Ace Your Homework with AI
Get the answers you need in no time with our AI-driven, step-by-step assistance
Get Started


