

Answered step by step
Verified Expert Solution
Question
1 Approved Answer
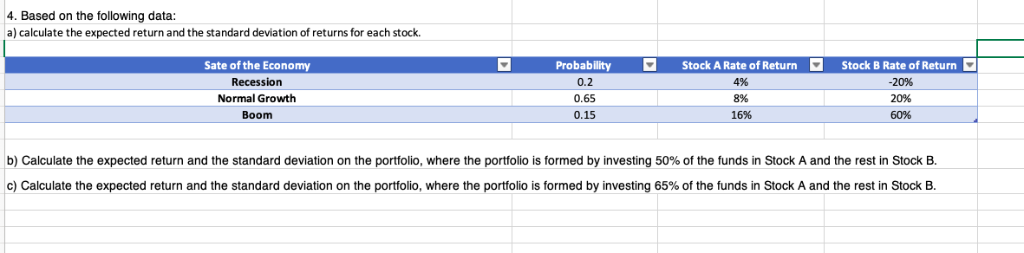
Please use Excel to show work 4. Based on the following data: ) calculate the expected return and the standard deviation of returns for each
Please use Excel to show work
4. Based on the following data: ) calculate the expected return and the standard deviation of returns for each stock. Stock B Rate of Return Sate of the Economy Probability Stock A Rate of Return Recession 0.2 4% 20% 0,65 Normal Growth 8% 20% 60% Boom 0.15 16% b) Calculate the expected return and the standard deviation on the portfolio, where the portfolio is formed by investing 50% of the funds in Stock A and the rest Stock B Stock B c) Calculate the expected return and the standard deviation on the portfolio, where the portfolio formed by investing 65% of the funds in Stock A and the restStep by Step Solution
There are 3 Steps involved in it
Step: 1

Get Instant Access to Expert-Tailored Solutions
See step-by-step solutions with expert insights and AI powered tools for academic success
Step: 2

Step: 3
Ace Your Homework with AI
Get the answers you need in no time with our AI-driven, step-by-step assistance
Get Started
Sovereign Debt Sustainability Multilateral Debt Treatment And The Credit Rating Impasse
Authors: Daniel Cash
1st Edition
1032198656, 978-1032198651