

Question
PLEASE USE R CODES TO INTERPRET THE RESULTS AND EXPLAIN THE QUESTION The data Restaurant_MinWage.xlsx has data for 2019 and 2021 for several restaurants in
PLEASE USE R CODES TO INTERPRET THE RESULTS AND EXPLAIN THE QUESTION
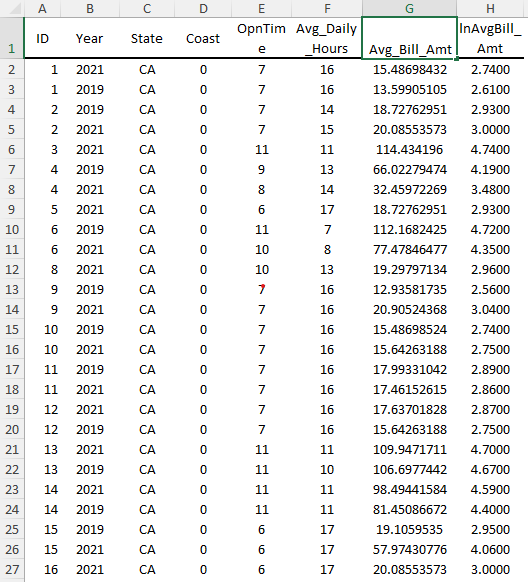
The data Restaurant_MinWage.xlsx has data for 2019 and 2021 for several restaurants in GA.
ID Identifies a specific restaurant
Year 2019 or 2021
State Georgia (GA) or California (CA)
Coast is 1 if located in a coastal town
Opening Time Hour of the day restaurant opens
Avg_Daily_Hours Number of hours the restaurant remains open daily
Average Bill Amount Average invoice amount for each transaction
ln(Average Bill_Amount) Natural log of Average Bill Amount
The above data is an unbalanced panel. First, clean the data to keep only restaurants for which you have observations for both 2019 and 2021.
[For this you might want to use the R function: make.pbalanced(restpanel, balance.type = "shared.individuals", balanced = TRUE)]
Use this balanced panel dataset to determine if the 2021 change in the minimum wage in California had a significant effect on raising restaurant charges by comparing with GA restaurants which had no such legislation in 2019 or 2021
Step by Step Solution
There are 3 Steps involved in it
Step: 1

Get Instant Access to Expert-Tailored Solutions
See step-by-step solutions with expert insights and AI powered tools for academic success
Step: 2

Step: 3
Ace Your Homework with AI
Get the answers you need in no time with our AI-driven, step-by-step assistance
Get Started
Data And Information Quality Dimensions, Principles And Techniques
Authors: Carlo Batini, Monica Scannapieco
1st Edition
3319241060, 9783319241067