Answered step by step
Verified Expert Solution
Question
1 Approved Answer
Please use the attached Statement of Operations to answer the following questions and show your work. Assume that the Board of Directors has chosen
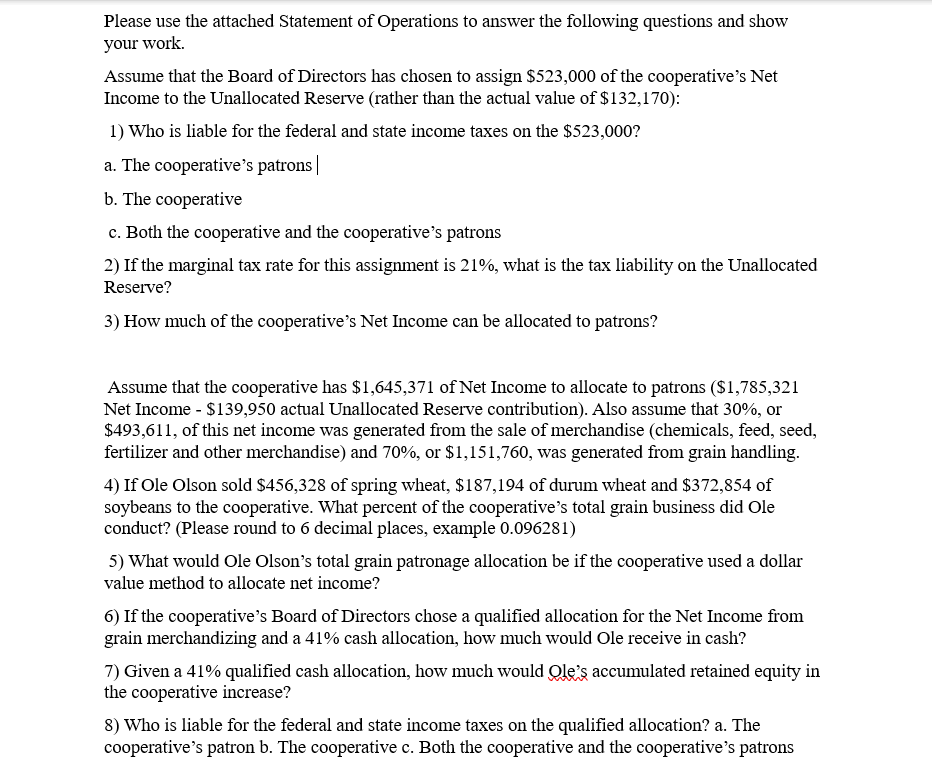
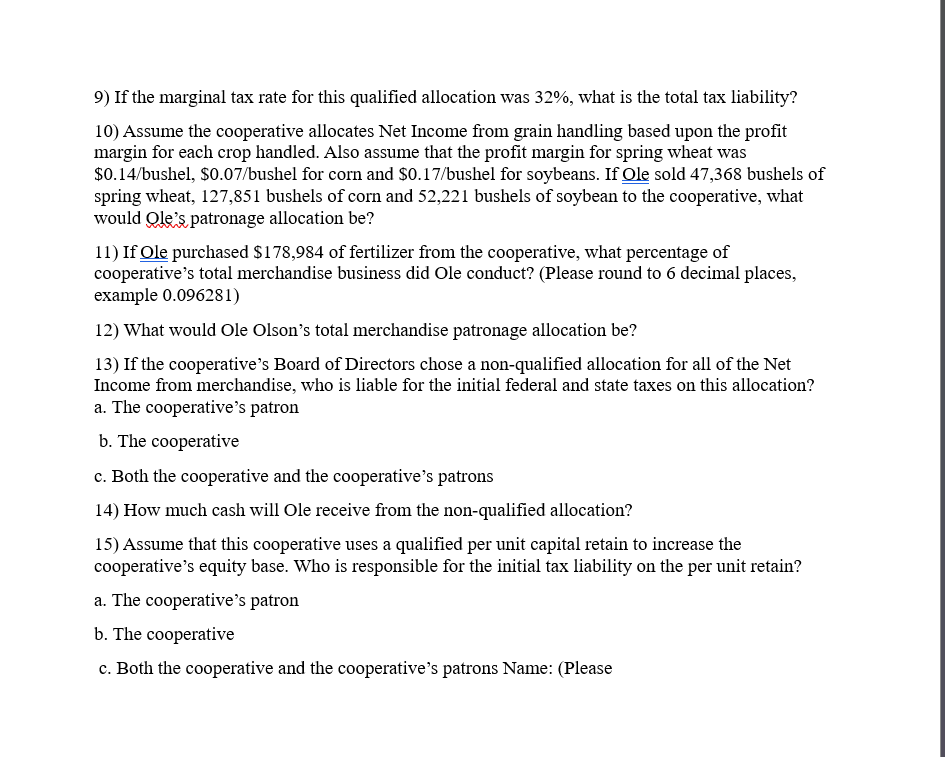
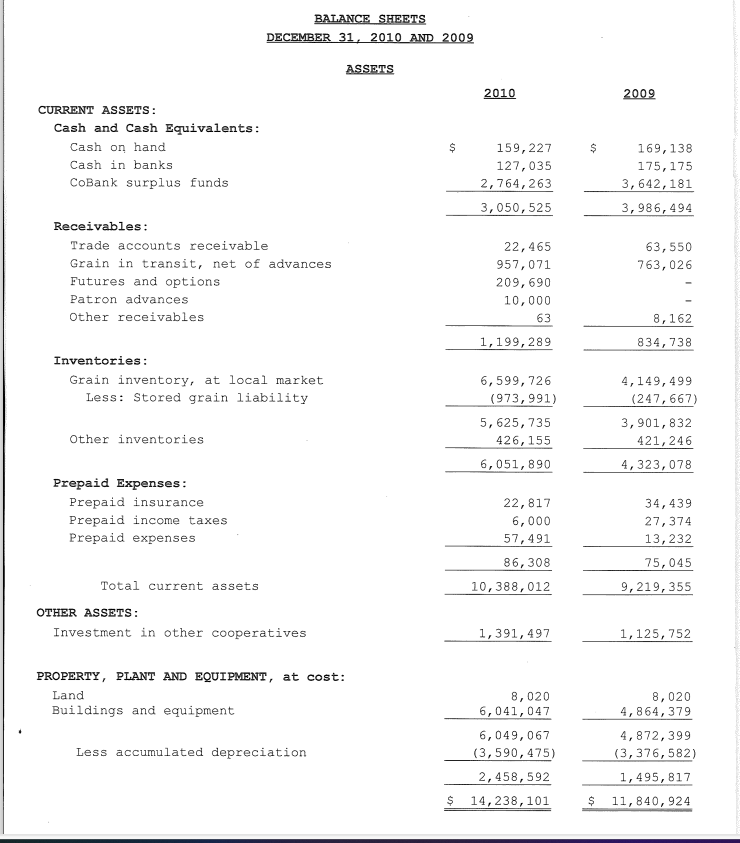
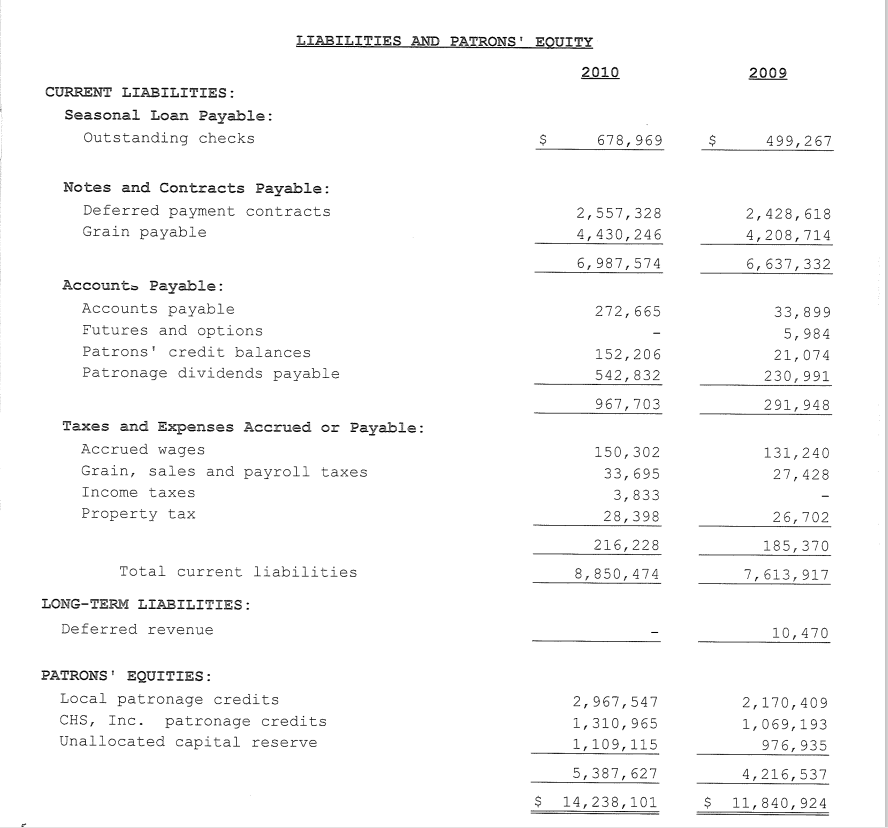
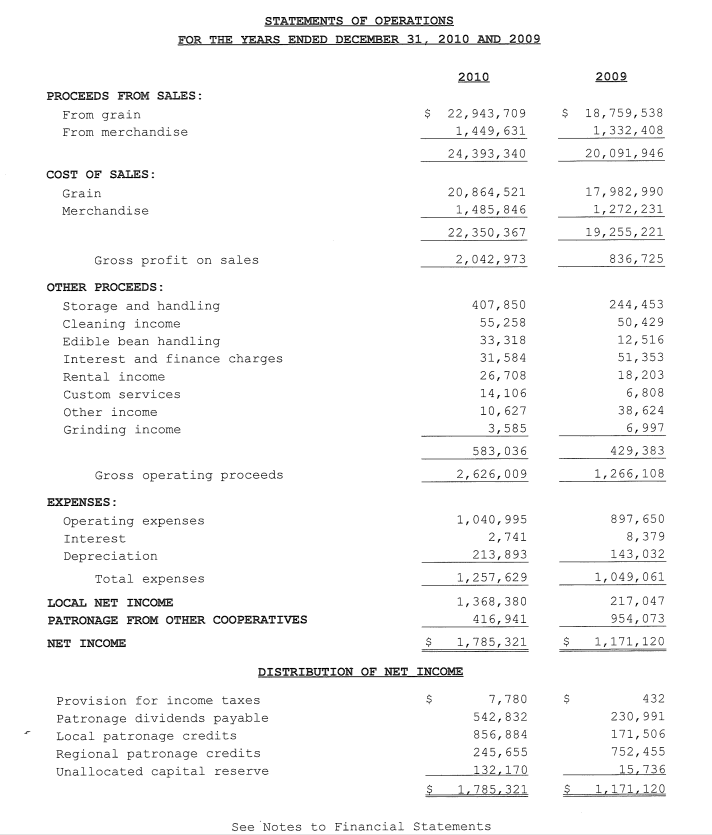
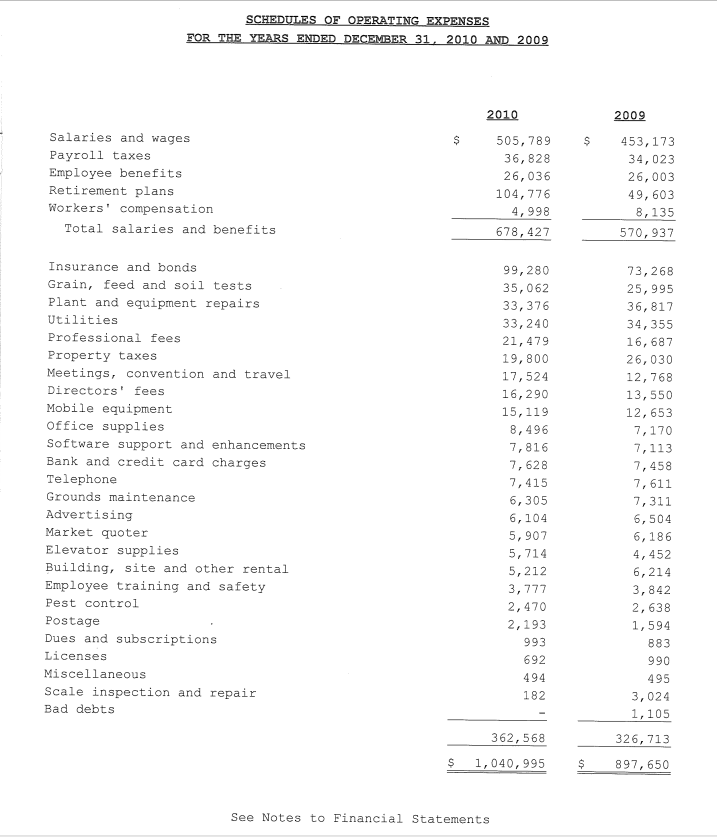
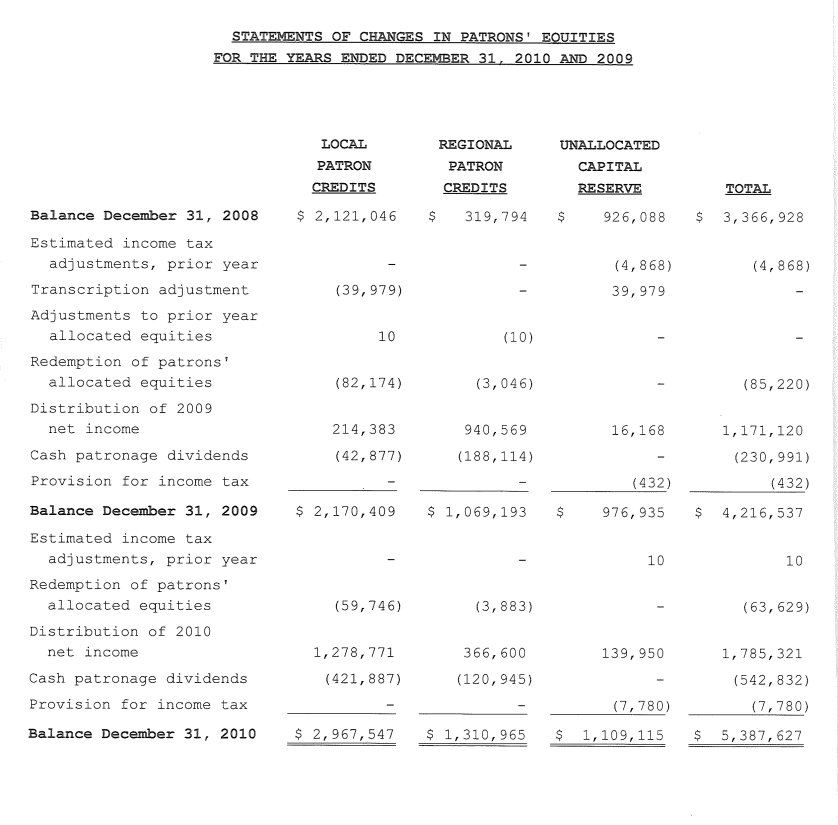
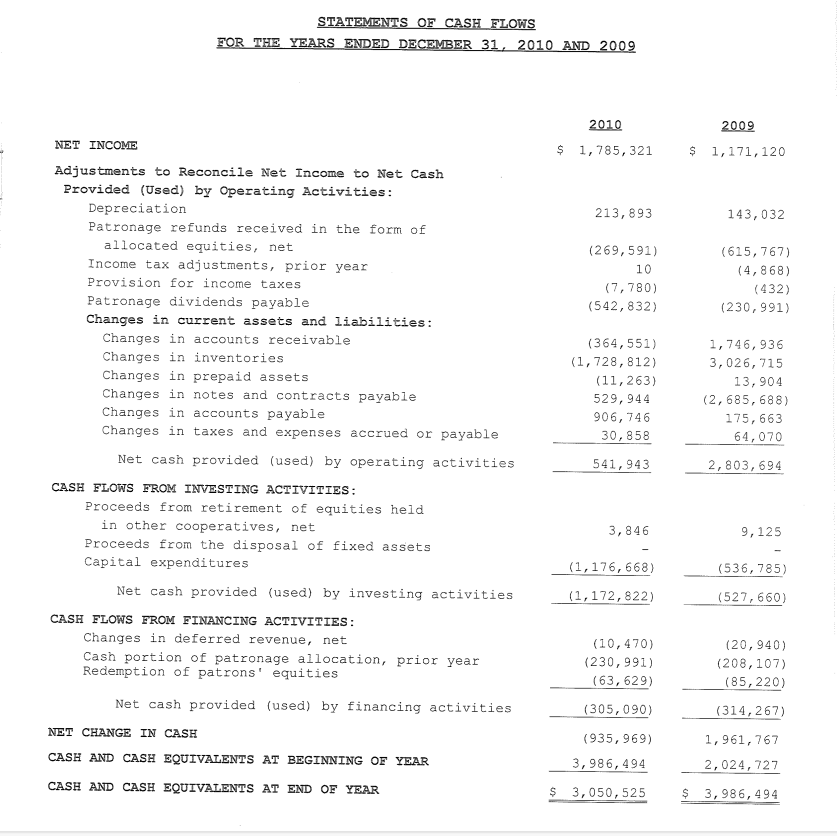
Please use the attached Statement of Operations to answer the following questions and show your work. Assume that the Board of Directors has chosen to assign $523,000 of the cooperative's Net Income to the Unallocated Reserve (rather than the actual value of $132,170): 1) Who is liable for the federal and state income taxes on the $523,000? a. The cooperative's patrons | b. The cooperative c. Both the cooperative and the cooperative's patrons 2) If the marginal tax rate for this assignment is 21%, what is the tax liability on the Unallocated Reserve? 3) How much of the cooperative's Net Income can be allocated to patrons? Assume that the cooperative has $1,645,371 of Net Income to allocate to patrons ($1,785,321 Net Income - $139,950 actual Unallocated Reserve contribution). Also assume that 30%, or $493,611, of this net income was generated from the sale of merchandise (chemicals, feed, seed, fertilizer and other merchandise) and 70%, or $1,151,760, was generated from grain handling. 4) If Ole Olson sold $456,328 of spring wheat, $187,194 of durum wheat and $372,854 of soybeans to the cooperative. What percent of the cooperative's total grain business did Ole conduct? (Please round to 6 decimal places, example 0.096281) 5) What would Ole Olson's total grain patronage allocation be if the cooperative used a dollar value method to allocate net income? 6) If the cooperative's Board of Directors chose a qualified allocation for the Net Income from grain merchandizing and a 41% cash allocation, how much would Ole receive in cash? 7) Given a 41% qualified cash allocation, how much would Ole's accumulated retained equity in the cooperative increase? 8) Who is liable for the federal and state income taxes on the qualified allocation? a. The cooperative's patron b. The cooperative c. Both the cooperative and the cooperative's patrons 9) If the marginal tax rate for this qualified allocation was 32%, what is the total tax liability? 10) Assume the cooperative allocates Net Income from grain handling based upon the profit margin for each crop handled. Also assume that the profit margin for spring wheat was $0.14/bushel, $0.07/bushel for corn and $0.17/bushel for soybeans. If Ole sold 47,368 bushels of spring wheat, 127,851 bushels of corn and 52,221 bushels of soybean to the cooperative, what would Ole's patronage allocation be? 11) If Ole purchased $178,984 of fertilizer from the cooperative, what percentage of cooperative's total merchandise business did Ole conduct? (Please round to 6 decimal places, example 0.096281) 12) What would Ole Olson's total merchandise patronage allocation be? 13) If the cooperative's Board of Directors chose a non-qualified allocation for all of the Net Income from merchandise, who is liable for the initial federal and state taxes on this allocation? a. The cooperative's patron b. The cooperative c. Both the cooperative and the cooperative's patrons 14) How much cash will Ole receive from the non-qualified allocation? 15) Assume that this cooperative uses a qualified per unit capital retain to increase the cooperative's equity base. Who is responsible for the initial tax liability on the per unit retain? a. The cooperative's patron b. The cooperative c. Both the cooperative and the cooperative's patrons Name: (Please CURRENT ASSETS: Cash and Cash Equivalents: Cash on hand Cash in banks CoBank surplus funds. BALANCE SHEETS DECEMBER 31, 2010 AND 2009 ASSETS 2010 2009 $ 159,227 $ 169,138 127,035 175,175 2,764,263 3,642,181 3,050,525 Receivables: Trade accounts receivable 22,465 Grain in transit, net of advances 957,071 Futures and options 209,690 Patron advances 10,000 Other receivables 63 1,199,289 3,986,494 63,550 763,026 8,162 834,738 Inventories: Grain inventory, at local market 6,599,726 4,149,499 Less: Stored grain liability (973,991) (247,667) Other inventories 5,625,735 426,155 3,901,832 421,246 6,051,890 4,323,078 Prepaid Expenses: Prepaid insurance Prepaid income taxes Prepaid expenses 22,817 34,439 6,000 27,374 57,491 13,232 86,308 75,045 Total current assets OTHER ASSETS: 10,388,012 9,219,355 Investment in other cooperatives PROPERTY, PLANT AND EQUIPMENT, at cost: Land Buildings and equipment Less accumulated depreciation 1,391,497 1,125,752 8,020 8,020 6,041,047 4,864,379 6,049,067 4,872,399 (3,590,475) (3,376,582) 2,458,592 1,495,817 $ 14,238,101 $ 11,840,924 CURRENT LIABILITIES: Seasonal Loan Payable: Outstanding checks LIABILITIES AND PATRONS' EQUITY 2010 Notes and Contracts Payable: 2009 $ 678,969 $ 499,267 Deferred payment contracts Grain payable 2,557,328 2,428,618 4,430,246 4,208,714 6,987,574 6,637,332 Accounts Payable: Accounts payable 272,665 Futures and options - Patrons' credit balances 152,206 Patronage dividends payable 542,832 33,899 5,984 21,074 230,991 967,703 291,948 Taxes and Expenses Accrued or Payable: Accrued wages 150,302 131,240 Grain, sales and payroll taxes. 33,695 27,428 Income taxes 3,833 Property tax 28,398 26,702 216,228 185,370 Total current liabilities 8,850,474 7,613,917 LONG-TERM LIABILITIES: Deferred revenue PATRONS EQUITIES: Local patronage credits CHS, Inc. patronage credits Unallocated capital reserve 10,470 2,967,547 2,170,409 1,310,965 1,069,193 1,109,115 5,387,627 976,935 4,216,537 $ 14,238,101 $ 11,840,924 STATEMENTS OF OPERATIONS FOR THE YEARS ENDED DECEMBER 31, 2010 AND 2009 2010 2009 PROCEEDS FROM SALES: From grain From merchandise $ 22,943,709 $ 18,759,538 1,449,631 1,332,408 24,393,340 20,091,946 COST OF SALES: Grain Merchandise 20,864,521 17,982,990 1,485,846 1,272,231 22,350,367 19,255,221 Gross profit on sales 2,042,973 836,725 OTHER PROCEEDS: Storage and handling 407,850 244,453 Cleaning income 55,258 50,429 Edible bean handling 33,318 12,516 Interest and finance charges 31,584 51,353 Rental income 26,708 18,203 Custom services 14,106 6,808 Other income 10,627 38,624 Grinding income 3,585 6,997 583,036 429,383 Gross operating proceeds 2,626,009 1,266,108 EXPENSES: Operating expenses Interest 1,040,995 2,741 897,650 8,379 Depreciation Total expenses LOCAL NET INCOME PATRONAGE FROM OTHER COOPERATIVES NET INCOME 213,893 143,032 1,257,629 1,368,380 416,941 1,049,061 217,047 954,073 $ 1,785,321 $ 1,171,120 DISTRIBUTION OF NET INCOME $ 7,780 $ 432 542,832 230,991 856,884 171,506 245,655 752,455 132,170 15,736 $ 1,785,321 $ 1,171,120 Provision for income taxes Patronage dividends payable Local patronage credits Regional patronage credits Unallocated capital reserve See Notes to Financial Statements SCHEDULES OF OPERATING EXPENSES FOR THE YEARS ENDED DECEMBER 31, 2010 AND 2009 2010 2009 Salaries and wages Payroll taxes Employee benefits Retirement plans Workers' compensation Total salaries and benefits $ 505,789 $ 453,173 36,828 34,023 26,036 26,003 104,776 49,603 4,998 8,135 678,427 570,937 Insurance and bonds 99,280 73,268 Grain, feed and soil tests 35,062 25,995 Plant and equipment repairs 33,376 36,817 Utilities 33,240 34,355 Professional fees 21,479 16,687 Property taxes 19,800 26,030 Meetings, convention and travel 17,524 12,768 Directors' fees. 16,290 13,550 Mobile equipment 15,119 12,653 Office supplies 8,496 7,170 Software support and enhancements 7,816 7,113 Bank and credit card charges 7,628 7,458 Telephone 7,415 7,611 Grounds maintenance 6,305 7,311 Advertising 6,104 6,504 Market quoter 5,907 6,186 Elevator supplies 5,714 4,452 Building, site and other rental 5,212 6,214 Employee training and safety 3,777 3,842 Pest control Postage Dues and subscriptions Licenses Miscellaneous Scale inspection and repair Bad debts 2,470 2,638 2,193 1,594 993 883 692 990 494 495 182 3,024 1,105 362,568 326,713 $ 1,040,995 $ 897,650 See Notes to Financial Statements STATEMENTS OF CHANGES IN PATRONS' EQUITIES FOR THE YEARS ENDED DECEMBER 31, 2010 AND 2009 Balance December 31, 2008 Estimated income tax adjustments, prior year Transcription adjustment Adjustments to prior year LOCAL PATRON CREDITS REGIONAL PATRON UNALLOCATED CAPITAL CREDITS RESERVE TOTAL $ 2,121,046 $ 319,794 $ 926,088 $ 3,366,928 (39,979) (4,868) 39,979 (4,868) allocated equities 10 (10) Redemption of patrons' allocated equities. (82,174) (3,046) (85,220) Distribution of 2009 net income 214,383 Cash patronage dividends Provision for income tax Balance December 31, 2009 Estimated income tax. (42,877) 940,569 (188,114) 16,168 1,171,120 (230,991) (432) (432) $ 2,170,409 $ 1,069,193 $ 976,935 $ 4,216,537 adjustments, prior year Redemption of patrons' allocated equities Distribution of 2010 net income Cash patronage dividends Provision for income tax Balance December 31, 2010 10 10 (59,746) (3,883) (63,629) 1,278,771 (421,887) 366,600 (120,945) 139,950 1,785,321 (542,832) (7,780) (7,780) $ 5,387,627 $ 2,967,547 $ 1,310,965 $ 1,109,115 NET INCOME STATEMENTS OF CASH FLOWS FOR THE YEARS ENDED DECEMBER 31, 2010 AND 2009 Adjustments to Reconcile Net Income to Net Cash Provided (Used) by Operating Activities: 2010 $ 1,785,321 2009 $ 1,171,120 Depreciation Patronage refunds received in the form of allocated equities, net 213,893 143,032 (269,591) (615,767) Income tax adjustments, prior year 10 (4,868) Provision for income taxes (7,780) (432) Patronage dividends payable (542,832) (230,991) Changes in current assets and liabilities: Changes in accounts receivable Changes in inventories (364,551) (1,728,812) 1,746,936 3,026,715 Changes in prepaid assets (11,263) 13,904 Changes in notes and contracts payable 529,944 (2,685,688) Changes in accounts payable 906,746 175,663 Changes in taxes and expenses accrued or payable 30,858 64,070 Net cash provided (used) by operating activities 541,943 2,803,694 CASH FLOWS FROM INVESTING ACTIVITIES: Proceeds from retirement of equities held in other cooperatives, net 3,846 9,125 Proceeds from the disposal of fixed assets Capital expenditures (1,176,668) (536,785) Net cash provided (used) by investing activities (1,172,822) (527,660) CASH FLOWS FROM FINANCING ACTIVITIES: Changes in deferred revenue, net (10,470) (20,940) Cash portion of patronage allocation, prior year Redemption of patrons' equities (230,991) (208,107) (63,629) (85,220) Net cash provided (used) by financing activities (305,090) (314,267) NET CHANGE IN CASH (935,969) 1,961,767 CASH AND CASH EQUIVALENTS AT BEGINNING OF YEAR 3,986,494 2,024,727 CASH AND CASH EQUIVALENTS AT END OF YEAR $ 3,050,525 $ 3,986,494
Step by Step Solution
There are 3 Steps involved in it
Step: 1

Get Instant Access to Expert-Tailored Solutions
See step-by-step solutions with expert insights and AI powered tools for academic success
Step: 2

Step: 3

Ace Your Homework with AI
Get the answers you need in no time with our AI-driven, step-by-step assistance
Get Started


