

Answered step by step
Verified Expert Solution
Question
1 Approved Answer
Please use the zoom function built into your computer (ctrl+scroll wheel) to be able to clearly read the font in the screenshot provided. Under the
Please use the zoom function built into your computer (ctrl+scroll wheel) to be able to clearly read the font in the screenshot provided.
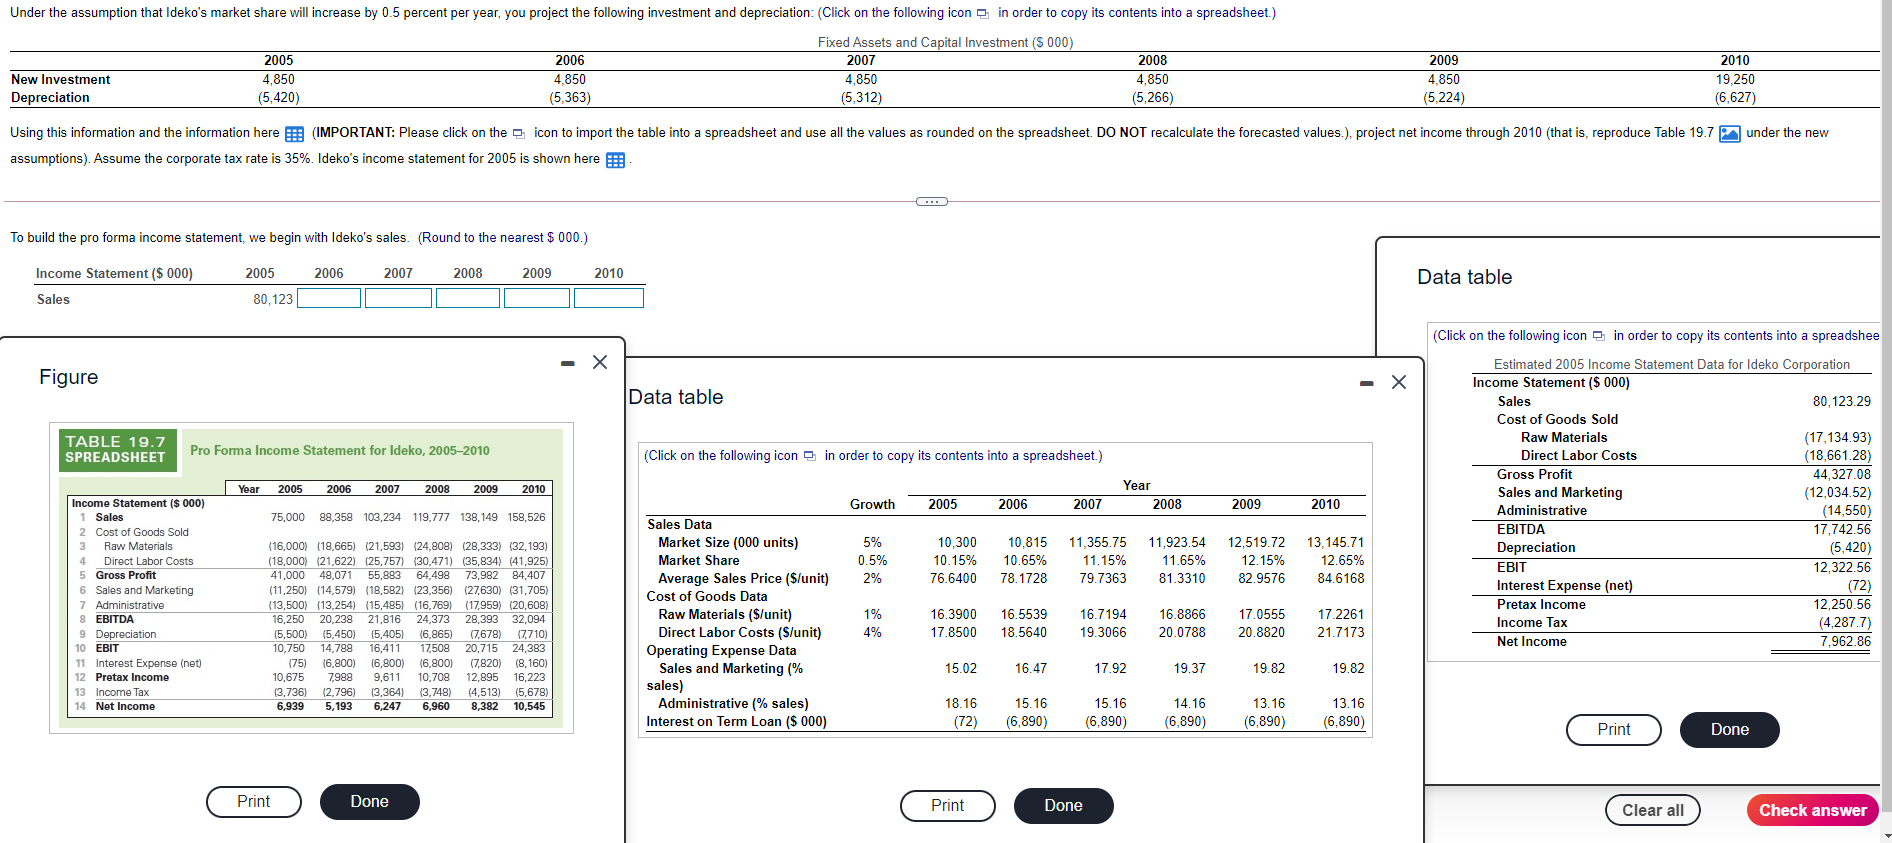
Under the assumption that Ideko's market share will increase by 0.5 percent per year, you project the following investment and depreciation: (Click on the following icon 2 in order to copy its contents into a spreadsheet.) Fixed Assets and Capital Investment ($ 000) 2005 2006 2007 2008 New Investment 4,850 4,850 4,850 4,850 Depreciation (5,363) (5,312) (5,266) 2009 4,850 (5,224) 2010 19,250 (5,420) (6,627) Using this information and the information here : (IMPORTANT: Please click on the icon to import the table into a spreadsheet and use all the values as rounded on the spreadsheet. DO NOT recalculate the forecasted values.), project net income through 2010 (that is, reproduce Table 19.7 under the new assumptions). Assume the corporate tax rate is 35%. Ideko's income statement for 2005 is shown here 6 . To build the pro forma income statement, we begin with Ideko's sales. (Round to the nearest $ 000.) Income Statement ($ 000) 2005 2006 2007 2008 2009 2010 Data table Sales 80,123 Figure Data table TABLE 19.7 SPREADSHEET Pro Forma Income Statement for Ideko, 2005-2010 (Click on the following icon 0 in order to copy its contents into a spreadsheet.) Year 2005 2006 2007 2008 2009 2010 Year 2008 (Click on the following icon in order to copy its contents into a spreadshee Estimated 2005 Income Statement Data for Ideko Corporation Income Statement ($ 000) Sales 80,123.29 Cost of Goods Sold Raw Materials (17,134.93) Direct Labor Costs (18,661.28) Gross Profit 44,327.08 Sales and Marketing (12,034.52) Administrative (14,550 EBITDA 17,742.56 Depreciation (5,420) EBIT 12,322.56 Interest Expense (net) (72) Pretax Income 12,250.56 Income Tax (4,287.7) Net Income 7,962.86 Growth 2005 2006 2007 2009 2010 75,000 88,358 103,234 119,777 138,149 158,526 5% 0.5% 2% 10,300 10.15% 76.6400 10.815 10.65% 78.1728 11,355.75 11.15% 79.7363 11,923.54 11.65% 81.3310 12,519.72 12.15% 82.9576 13,145.71 12.65% 84.6168 Income Statement ($ 000) 1 Sales 2 Cost of Goods Sold 3 Raw Materials 4 Direct Labor Costs 5 Gross Profit 6 Sales and Marketing 7 Administrative 8 EBITDA 9 Depreciation 10 EBIT 11 Interest Expense (net) 12 Pretax Income 13 Income Tax 14 Net Income (16,000) (18,665) (21,593) (24,808) (28,333) (32,193) (18,000) (21,622) (25,757) (30,471) (35,834) (41,925) 41,000 49,071 55.882 64,498 73,982 84.407 (11,250) (14,579) (18,582) 123.356) (27630) (31,705) (13,500) (13,254) (15.485) (16,769) (17,959) (20,608) 16.250 20.238 21,816 24 372 28,393 32,094 15,500) (5.450) 15,405) 16,865) (7,678) 17,710) 10.750 14.788 16.411 17,508 20,715 24,383 (75) (6,800) 16,800) (6,800) (7,820) (8,160) 9,611 10,708 12,895 16,223 (3,736) (2.796) (3,364) (3,748) (4,513) (5,678) 6,939 5,193 6,247 6,960 8,382 10,545 Sales Data Market Size (000 units) Market Share Average Sales Price ($/unit) Cost of Goods Data Raw Materials ($/unit) Direct Labor Costs (S/unit) Operating Expense Data Sales and Marketing (% sales) Administrative (% sales) Interest on Term Loan ($ 000) 1% 4% 16.3900 17.8500 16.5539 18.5640 16.7194 19.3066 16.8866 20.0788 17.0555 20.8820 17.2261 21.7173 15.02 16.47 17.92 19.37 19.82 19.82 10,675 7,988 18.16 (72) 15.16 (6,890) 15.16 (6,890) 14.16 (6,890) 13.16 (6,890) 13.16 (6,890) Print Done Print Done Print Done Clear all CheckStep by Step Solution
There are 3 Steps involved in it
Step: 1

Get Instant Access to Expert-Tailored Solutions
See step-by-step solutions with expert insights and AI powered tools for academic success
Step: 2

Step: 3
Ace Your Homework with AI
Get the answers you need in no time with our AI-driven, step-by-step assistance
Get Started
Lectures On Public Economics
Authors: Anthony B. Atkinson, Joseph E. Stiglitz
1st Edition
0691166412, 978-0691166414