Answered step by step
Verified Expert Solution
Question
1 Approved Answer
Please using the excel table below to answer this question 3. Compare and contrast the profitability of each doll under the new and old systems.

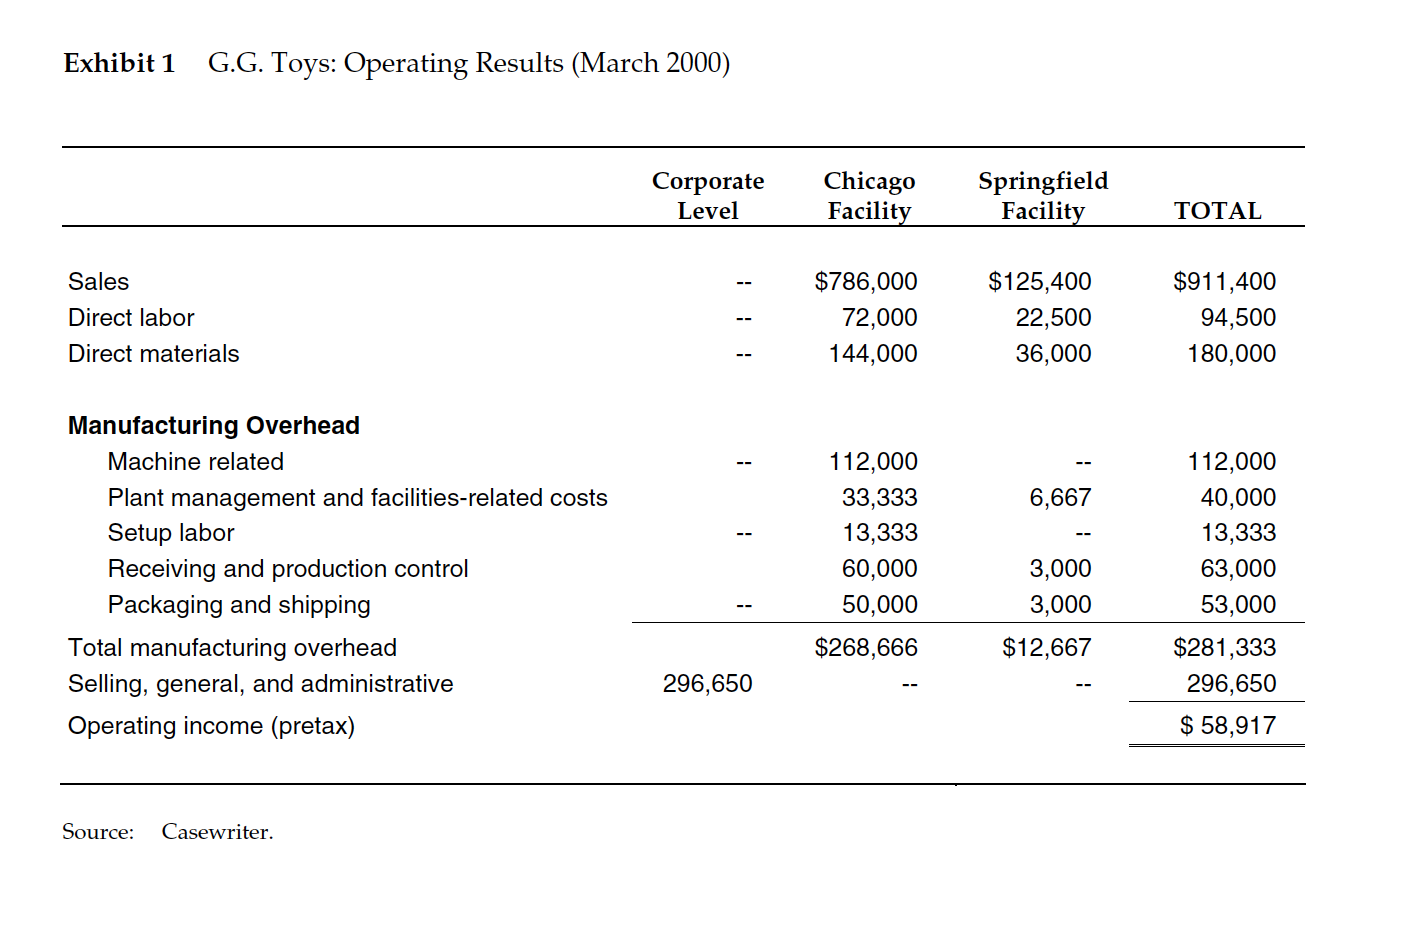
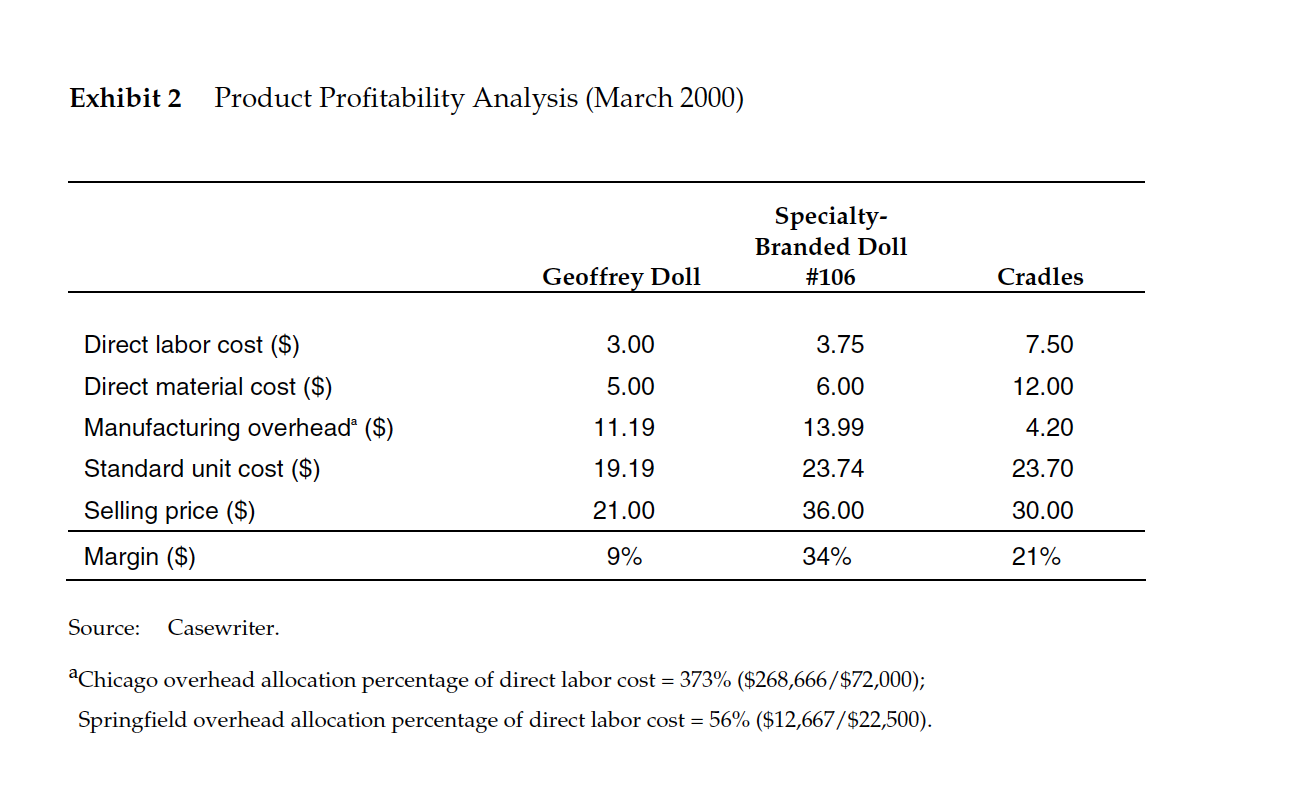
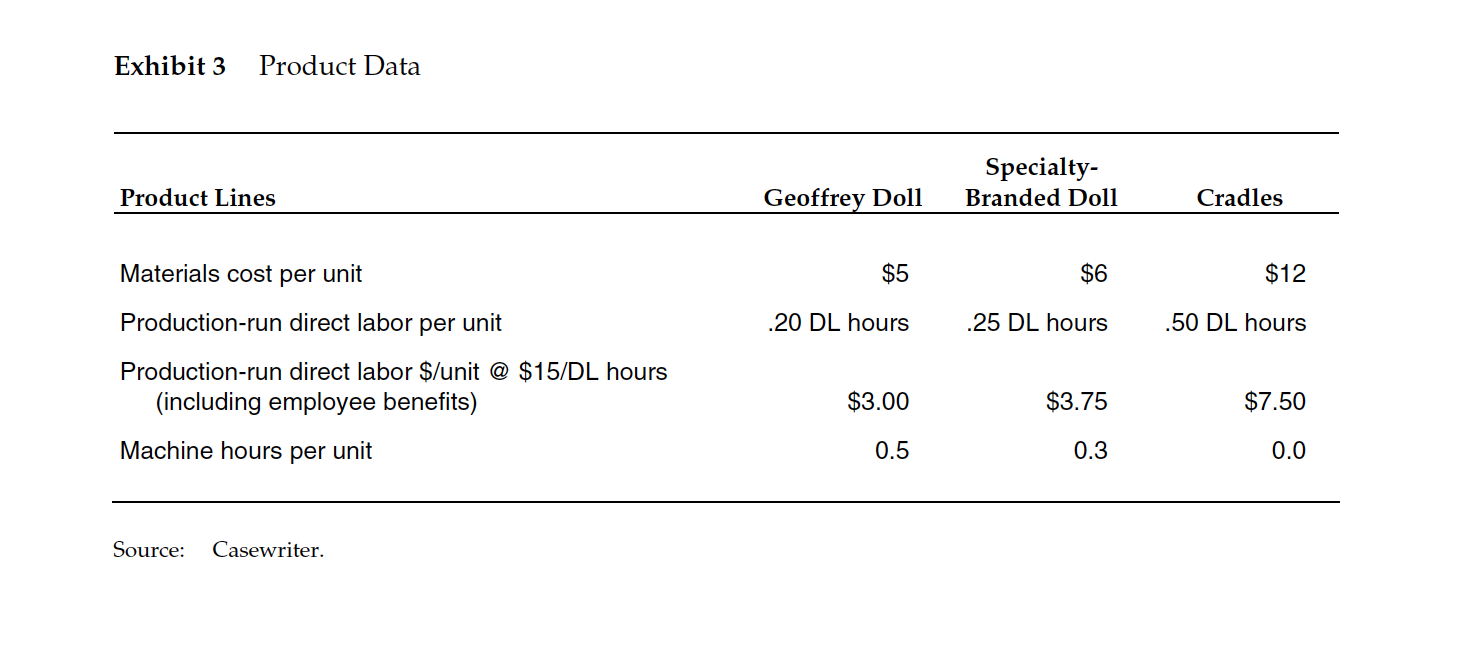
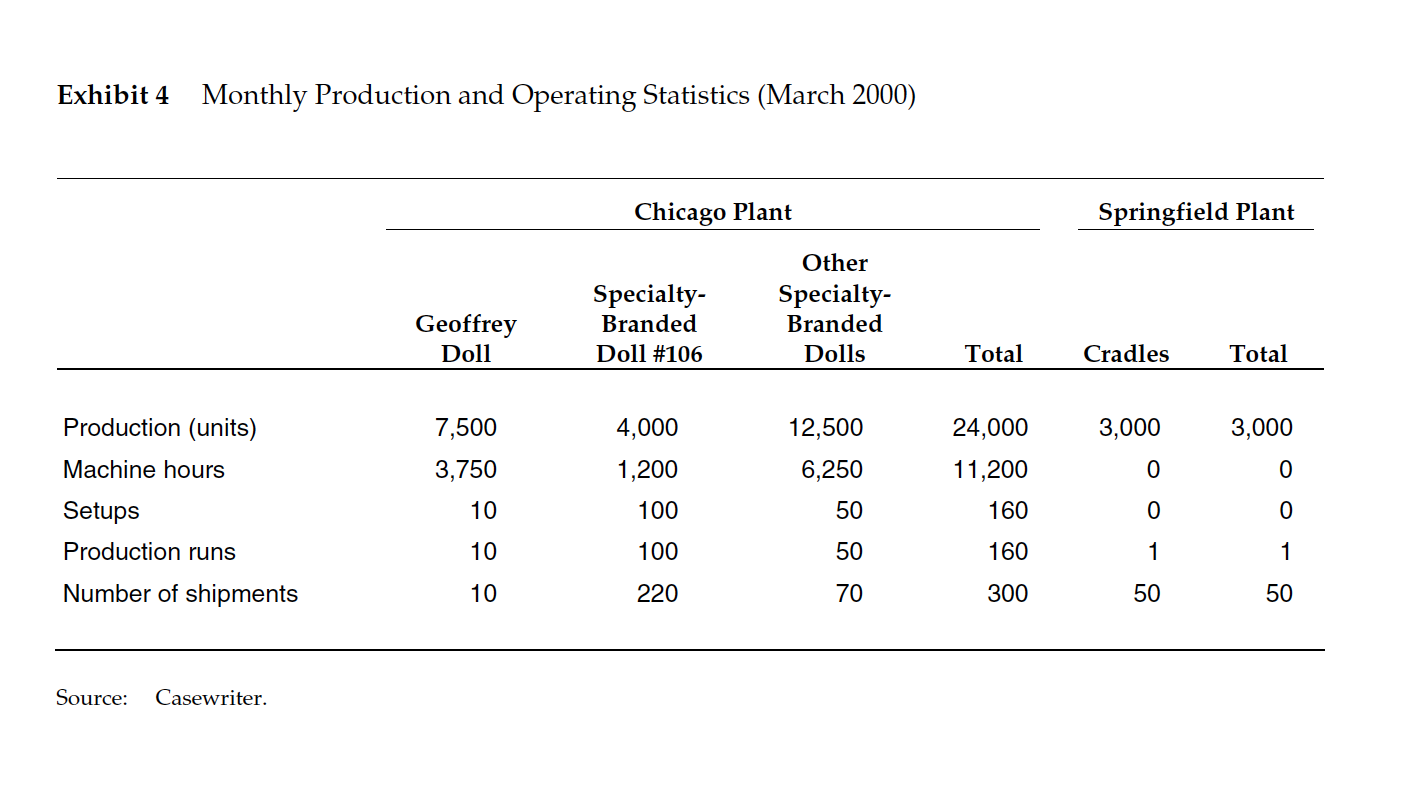 Please using the excel table below to answer this question
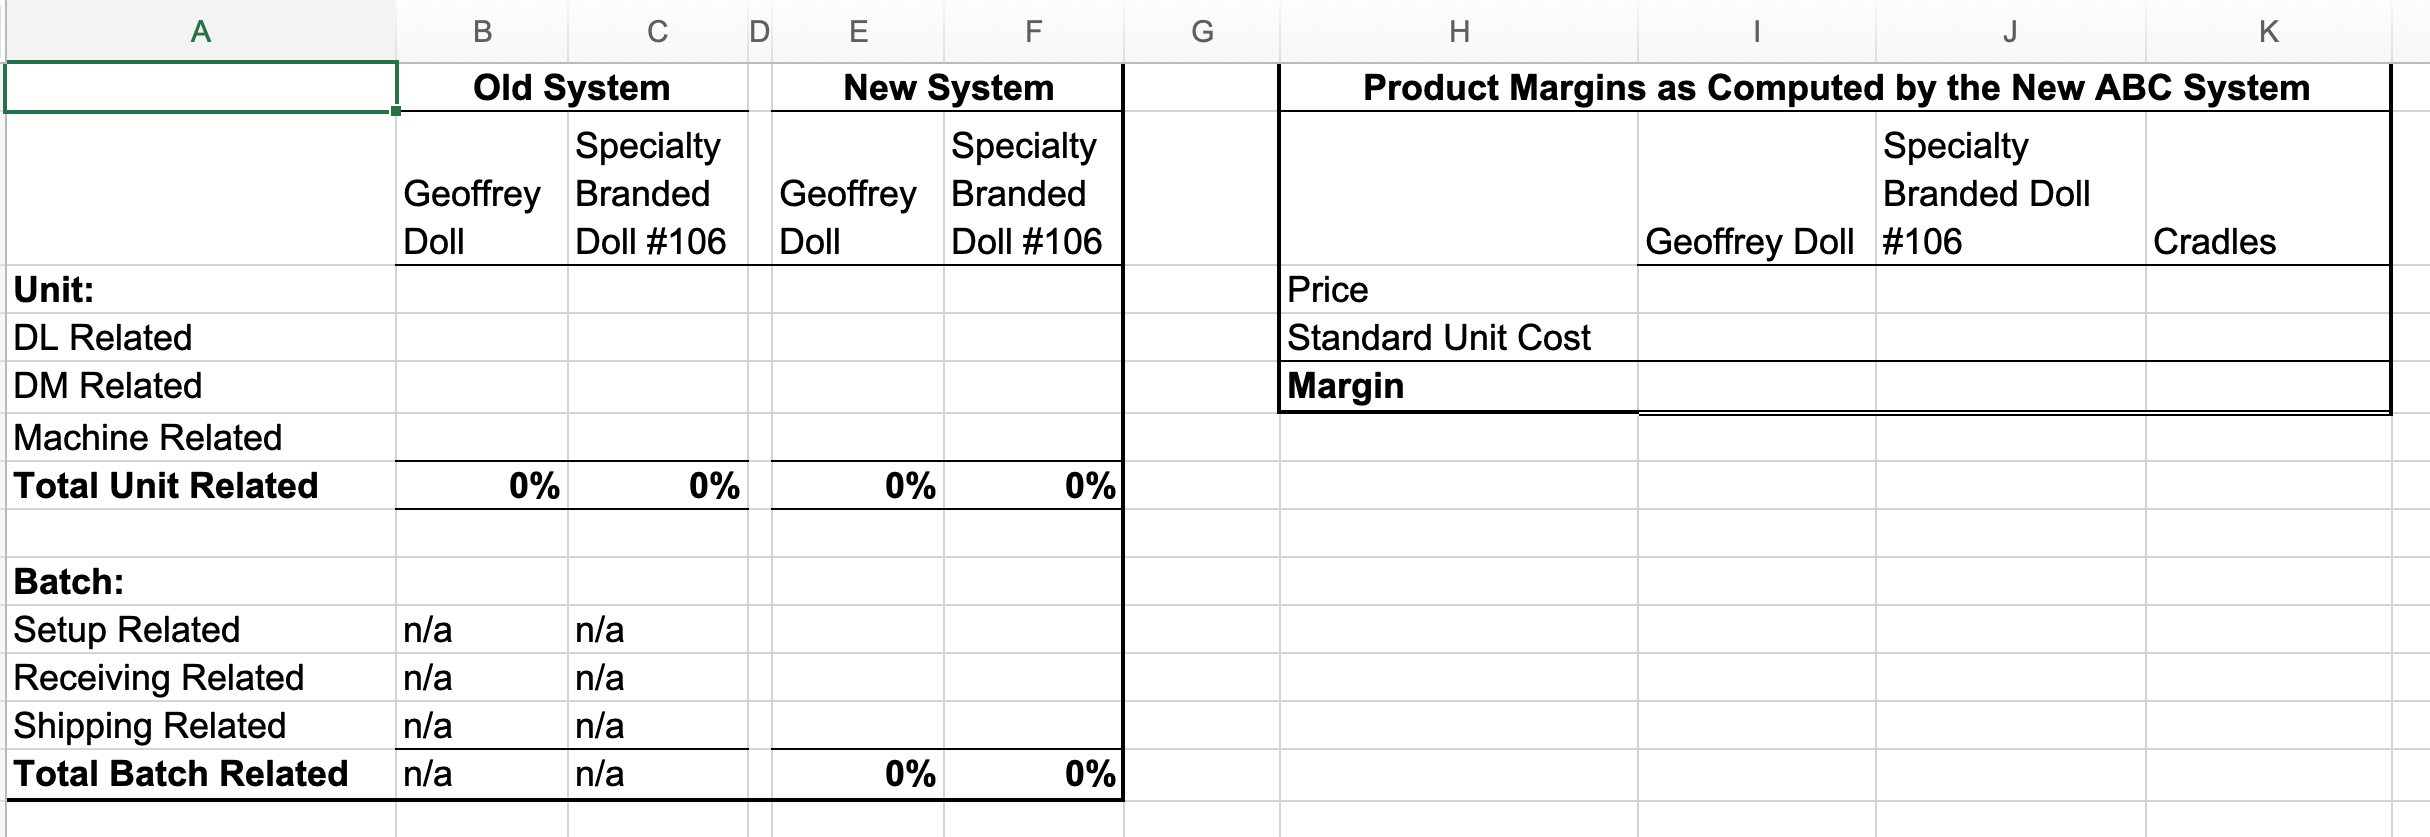
3. Compare and contrast the profitability of each doll under the new and old systems. Based on your recomputed product costs, what actions would you recommend the company consider to enhance its profitability? What additional information would you like to have to make these recommendations? Exhibit 1 G.G. Toys: Operating Results (March 2000) Corporate Level Chicago Facility Springfield Facility TOTAL Sales Direct labor Direct materials $786,000 72,000 144,000 $125,400 22,500 36,000 $911,400 94,500 180,000 6,667 Manufacturing Overhead Machine related Plant management and facilities-related costs Setup labor Receiving and production control Packaging and shipping Total manufacturing overhead Selling, general, and administrative Operating income (pretax) 112,000 33,333 13,333 60,000 50,000 $268,666 -- 3,000 3,000 $12,667 112,000 40,000 13,333 63,000 53,000 $281,333 296,650 $ 58,917 296,650 Source: Casewriter. Exhibit 2 Product Profitability Analysis (March 2000) Specialty- Branded Doll #106 Geoffrey Doll Cradles 3.00 3.75 7.50 5.00 6.00 12.00 11.19 13.99 4.20 Direct labor cost ($) Direct material cost ($) Manufacturing overhead ($) Standard unit cost ($) Selling price ($) Margin ($) 19.19 23.74 23.70 21.00 36.00 30.00 9% 34% 21% Source: Casewriter. a Chicago overhead allocation percentage of direct labor cost = 373% ($268,666/$72,000); Springfield overhead allocation percentage of direct labor cost = 56% ($12,667/$22,500). Exhibit 3 Product Data Specialty- Branded Doll Product Lines Geoffrey Doll Cradles Materials cost per unit $5 $6 $12 Production-run direct labor per unit .20 DL hours .25 DL hours .50 DL hours Production-run direct labor $/unit @ $15/DL hours (including employee benefits) $3.00 $3.75 $7.50 Machine hours per unit 0.5 0.3 0.0 Source: Casewriter. Exhibit 4 Monthly Production and Operating Statistics (March 2000) Chicago Plant Springfield Plant Other Specialty- Branded Dolls Specialty- Branded Doll #106 Geoffrey Doll Total Cradles Total Production (units) 3,000 3,000 7,500 3,750 Machine hours 4,000 1,200 100 12,500 6,250 50 24,000 11,200 160 0 0 10 0 Setups Production runs 10 100 50 160 1 1 Number of shipments 10 220 70 300 50 50 Source: Casewriter. A B E F . J K. Old System Specialty Geoffrey Branded Doll Doll #106 New System Specialty Geoffrey Branded Doll Doll #106 Product Margins as Computed by the New ABC System Specialty Branded Doll Geoffrey Doll #106 Cradles Price Standard Unit Cost Margin Unit: DL Related DM Related Machine Related Total Unit Related 0% 0% 0% 0% Batch: Setup Related Receiving Related Shipping Related Total Batch Related n/a n/a n/a n/a n/a n/a n/a n/a 0% 0% 3. Compare and contrast the profitability of each doll under the new and old systems. Based on your recomputed product costs, what actions would you recommend the company consider to enhance its profitability? What additional information would you like to have to make these recommendations? Exhibit 1 G.G. Toys: Operating Results (March 2000) Corporate Level Chicago Facility Springfield Facility TOTAL Sales Direct labor Direct materials $786,000 72,000 144,000 $125,400 22,500 36,000 $911,400 94,500 180,000 6,667 Manufacturing Overhead Machine related Plant management and facilities-related costs Setup labor Receiving and production control Packaging and shipping Total manufacturing overhead Selling, general, and administrative Operating income (pretax) 112,000 33,333 13,333 60,000 50,000 $268,666 -- 3,000 3,000 $12,667 112,000 40,000 13,333 63,000 53,000 $281,333 296,650 $ 58,917 296,650 Source: Casewriter. Exhibit 2 Product Profitability Analysis (March 2000) Specialty- Branded Doll #106 Geoffrey Doll Cradles 3.00 3.75 7.50 5.00 6.00 12.00 11.19 13.99 4.20 Direct labor cost ($) Direct material cost ($) Manufacturing overhead ($) Standard unit cost ($) Selling price ($) Margin ($) 19.19 23.74 23.70 21.00 36.00 30.00 9% 34% 21% Source: Casewriter. a Chicago overhead allocation percentage of direct labor cost = 373% ($268,666/$72,000); Springfield overhead allocation percentage of direct labor cost = 56% ($12,667/$22,500). Exhibit 3 Product Data Specialty- Branded Doll Product Lines Geoffrey Doll Cradles Materials cost per unit $5 $6 $12 Production-run direct labor per unit .20 DL hours .25 DL hours .50 DL hours Production-run direct labor $/unit @ $15/DL hours (including employee benefits) $3.00 $3.75 $7.50 Machine hours per unit 0.5 0.3 0.0 Source: Casewriter. Exhibit 4 Monthly Production and Operating Statistics (March 2000) Chicago Plant Springfield Plant Other Specialty- Branded Dolls Specialty- Branded Doll #106 Geoffrey Doll Total Cradles Total Production (units) 3,000 3,000 7,500 3,750 Machine hours 4,000 1,200 100 12,500 6,250 50 24,000 11,200 160 0 0 10 0 Setups Production runs 10 100 50 160 1 1 Number of shipments 10 220 70 300 50 50 Source: Casewriter. A B E F . J K. Old System Specialty Geoffrey Branded Doll Doll #106 New System Specialty Geoffrey Branded Doll Doll #106 Product Margins as Computed by the New ABC System Specialty Branded Doll Geoffrey Doll #106 Cradles Price Standard Unit Cost Margin Unit: DL Related DM Related Machine Related Total Unit Related 0% 0% 0% 0% Batch: Setup Related Receiving Related Shipping Related Total Batch Related n/a n/a n/a n/a n/a n/a n/a n/a 0% 0%
Step by Step Solution
There are 3 Steps involved in it
Step: 1

Get Instant Access to Expert-Tailored Solutions
See step-by-step solutions with expert insights and AI powered tools for academic success
Step: 2

Step: 3

Ace Your Homework with AI
Get the answers you need in no time with our AI-driven, step-by-step assistance
Get Started


