PLEASE WORK IN EXCEL AND SHOW ME HOW
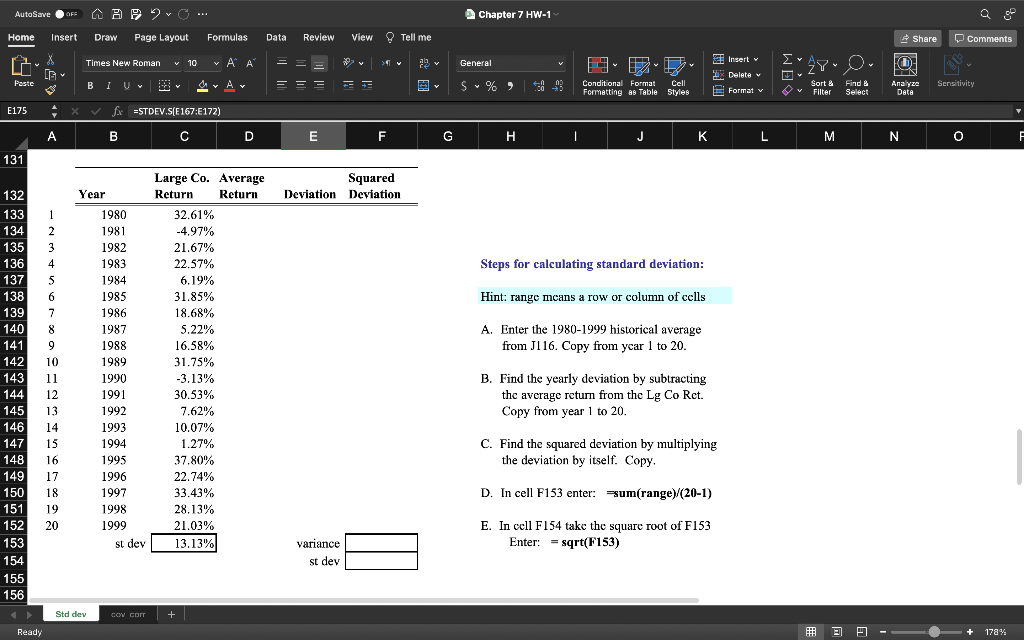
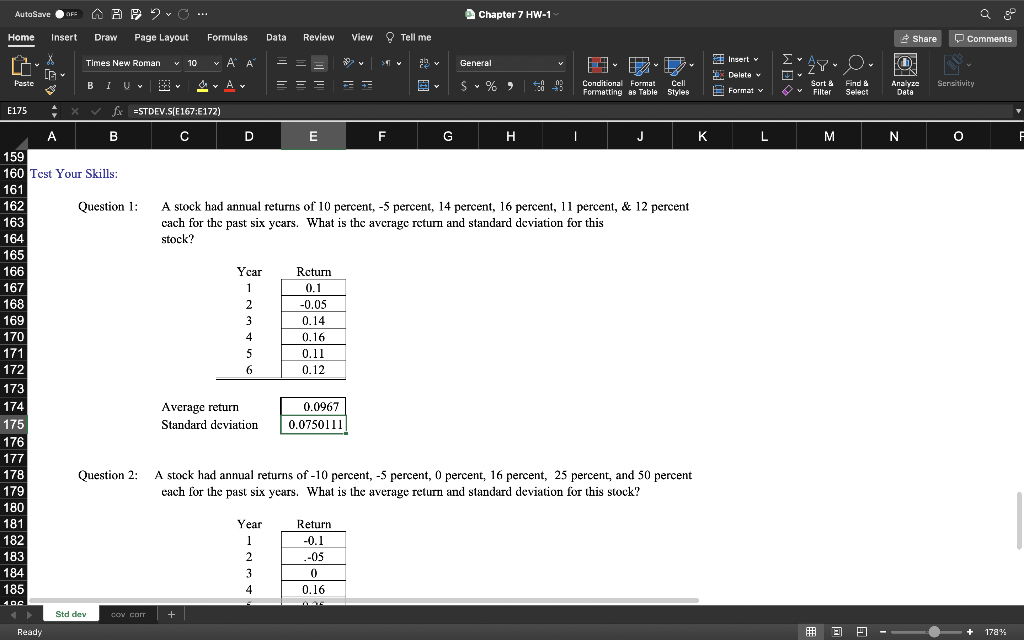
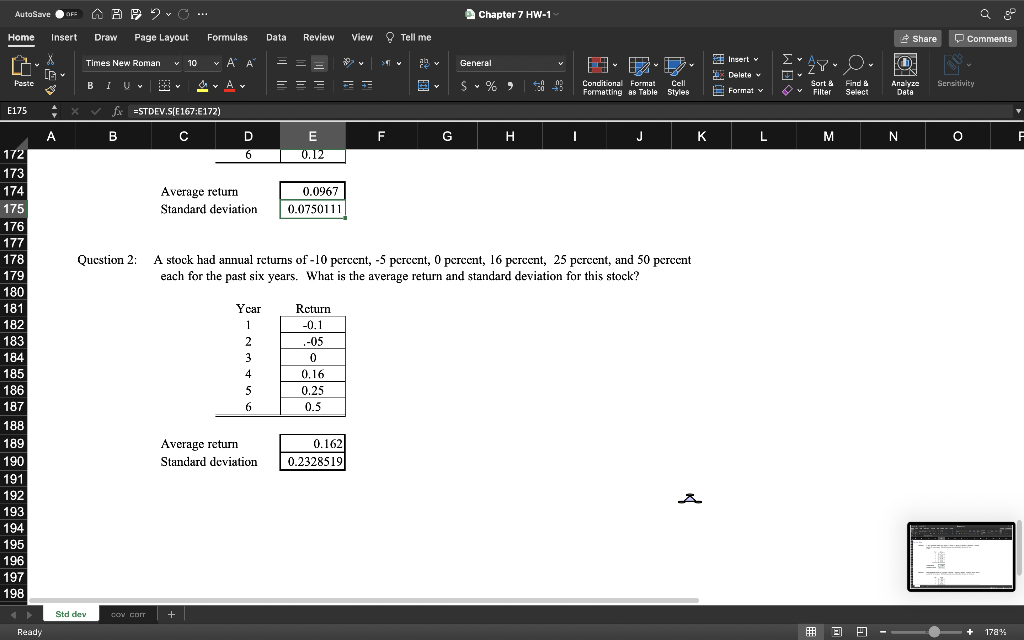
AutoSave OF APO. Chapter 7 HW-1 Home Insert Draw Page Layout Formulas Data Review View Tell me Share Comments Times New Roman v 10 ~ APA V v General X G IZB Insert 2. Delete v Format v WOO 27-O 0 Paste BIU Y A = = = S% > 393 Conditional Format Cell Formatting as Table Styles Sort & Filter Find Select Analyze Data Sensitivity E175 fx =STDEV.S(E167:6172) A B D E F G H | J L M N 0 F 131 Year Squared Deviation Deviation 1 2 3 4 5 Steps for calculating standard deviation: Hint: range means a row or column of cells A. Enter the 1980-1999 historical average from J116. Copy from ycar 1 to 20. 132 133 134 135 136 137 10 138 139 140 140 141 142 443 412 143 4 144 u 145 146 147 148 149 150 151 152 153 154 155 156 % 6 7 7 8 9 10 10 11 12 13 14 15 16 17 18 19 20 Large Co. Average Return Return 32.61% -4.97% 21.67% 22.57% 22:57% 6.19% 31.85% 18.68% 5.22% 16.58% 31.75% -3.13% 30.53% 7.62% 10.07% 1.27% 37.80% 22.74% 33.43% 28.13% 21.03% 13.13% 1980 1981 1982 1983 1984 1985 1986 1987 1987 1998 1988 1989 100 1990 1001 1991 1003 1992 Toon 1993 100 1994 1995 1996 1997 1998 1999 st dev B. Find the yearly deviation by subtracting the average return from the Lg Co Rct. Copy from year 1 to 20. C. Find the squared deviation by multiplying the deviation by itself. Copy, D. In cell F153 enter: =sum(range)/(20-1) E. In cell F154 take the square root of F153 Enter: = sqrt(F153) variance st dev Std dev COW cor + Ready 2 + 178% AutoSave OF APO. Chapter 7 HW-1 Home Insert Draw Page Layout Formulas Data Review View Tell me Share Comments Times New Roman v 10 ~ APA V v General X G EZ Insert 2. Delete v Format v Ayu O o v Paste B IUB Y Av = = = S% > 9.93 Conditional Format Cell Formatting as Table Styles Sort & Filter Find Select Analyze Data Sensitivity E175 fx =STDEV.S(E167:6172) D E F G | J K L M N 0 F A stock had annual returns of 10 percent, -5 percent, 14 percent, 16 percent, 11 percent, & 12 percent cach for the past six years. What is the average return and standard deviation for this stock? A B 159 160 Test Your Skills 161 162 Question 1: 163 164 10+ 165 100 166 167 107 168 169 170 171 172 173 174 175 176 177 178 Question 2: 179 180 TOU Ycar 1 2 3 4 5 Return 0.1 -0.05 0.14 0.16 0.11 0.12 6 0.0967 Average return Standard deviation 0.0750111 A stock had annual returns of -10 percent, -5 percent, 0 percent, 16 percent, 25 percent, and 50 percent each for the past six years. What is the average return and standard deviation for this stock? 181 182 183 184 185 Year 1 2 3 4 Return -0.1 .-OS 0 0.16 100 Std dev CON CART + Ready 2 + 178% AutoSave OF APO. Chapter 7 HW-1 Home Insert Draw Page Layout Formulas Data Review View Tell me Share Comments Times New Roman v 10 X G v A A V v General Insert 2. Delete v Format v Ayu O o v Paste B 10 Av Y = = = S% > :8 -13 Sensitivity Conditional Format Cell Formatting as Table Styles Sort & Filter Find Select Analyze Data E175 fx ESTDEV.S(E167:E172) A B F G H I J K L M N F D 6 E 0.12 Average return Standard deviation 0.0967 0.0750111 Question 2: A stock had annual returns of -10 percent, -5 percent, 0 percent, 16 percent, 25 percent, and 50 percent each for the past six years. What is the average return and standard deviation for this stock? 172 173 174 175 176 177 178 179 180 181 182 183 184 185 186 187 188 189 190 191 192 193 194 195 196 197 198 Y car 1 2 3 4 5 6 Return -0.1 .-05 0 0.16 0.25 0.5 Average return Standard deviation 0.162 0.2328519 Std dev COW COIT + Ready + 178%