Answered step by step
Verified Expert Solution
Question
1 Approved Answer
Please write a function that takes input of an institution of higher learning and a vector of variables and outputs a multipanel plot showing histograms
Please write a function that takes input of an institution of higher learning and a vector of variables and outputs a multipanel plot showing histograms of those variables with the position of the specified institution marked in the histogram. The plots should be based on the College Scorecard data.
Choose a list of four quantitative variables that you think would be interesting to plot. It should show plots for all four variables by default, but allow a user to select a smaller subset of the variables. The inputs of your function should also include two variables that specify whether the histograms should include all institutions or only include institutions that match the target institution in the type of control public privatenotforprofit, or forprofit and level year, year, lessthanyear
Note that some variables are not defined for all types of institutions. For example, completion rate has separate variables for fouryear and lessthanfouryear institutions. Thus, the histogram for this variable always includes only the same type of institutions as the target institution. Your plots should have descriptive labels and titles. The function should give a descriptive error message if the inputs are not correct eg the institution name or the variables are not known
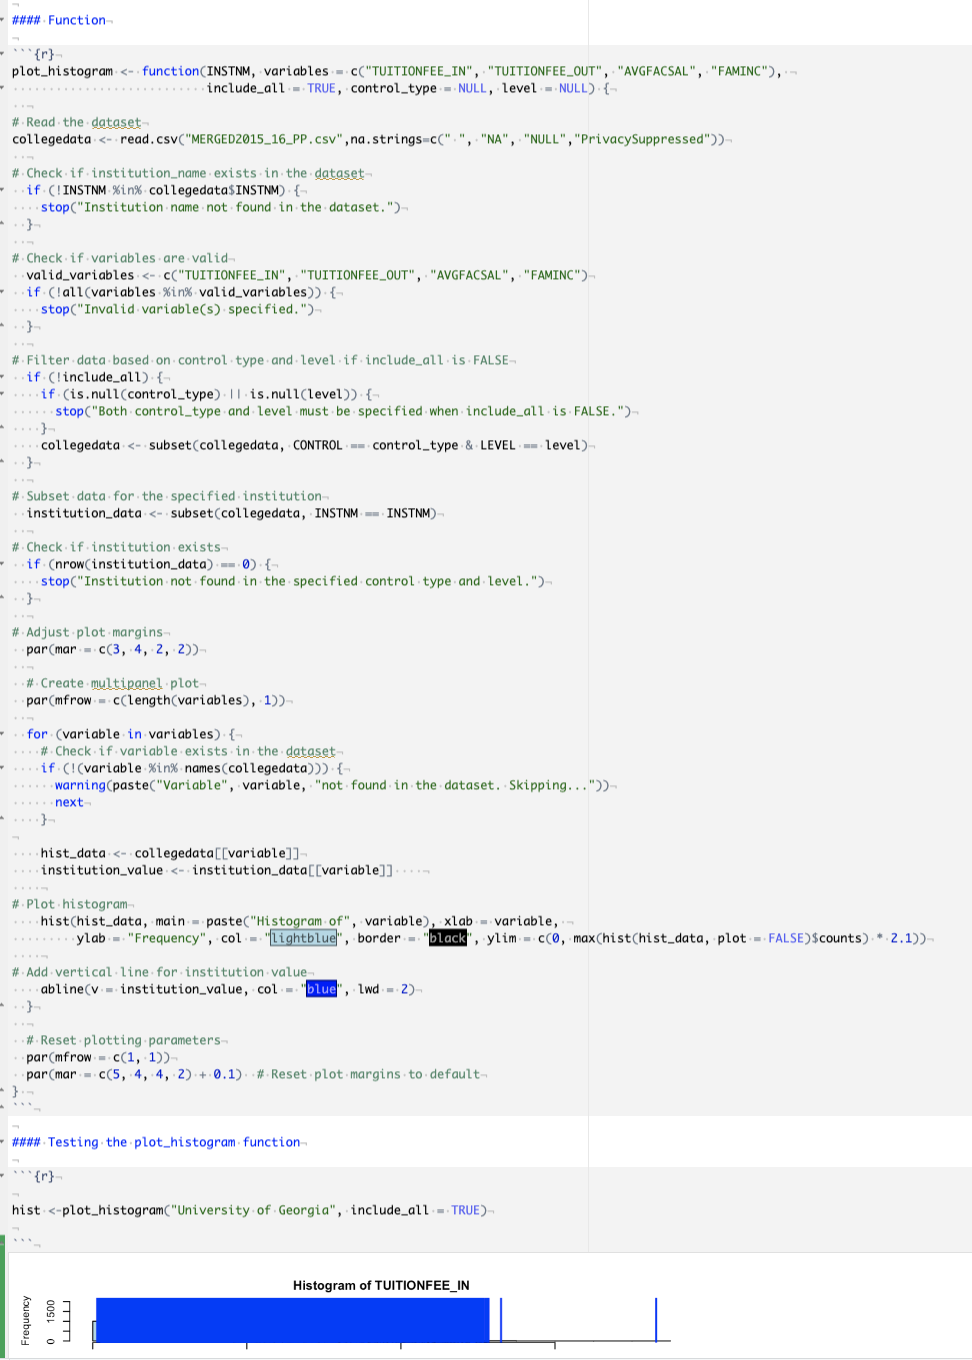
I have attempted the code in R below but I believe it has some issues still. The output of histograms does not show the frequency well and the institution selected at the end 'University of Alabama' is not visible as specified in the question. Please help me resolve these issues and ensure I am answering the question to completion in R After this, please replicate the exact same function in Python and provide code.
#### Function
r
plothistogram functionINSTNM variables cTUITIONFEEIN "TUITIONFEEOUT", "AVGFACSAL", "FAMINC"
includeall TRUE, controltype NULL, level NULL
# Read the dataset
collegedata read.csvMERGEDPPcsvnastringscNA "NULL","PrivacySuppressed"
# Check if institutionname exists in the dataset
if INSTNM in collegedata$INSTNM
stopInstitution name not found in the dataset."
# Check if variables are valid
validvariables cTUITIONFEEIN "TUITIONFEEOUT", "AVGFACSAL", "FAMINC"
if allvariables in validvariables
stopInvalid variables specified."
# Filter data based on control type and level if includeall is FALSE
if includeall
if isnullcontroltype isnulllevel
stopBoth controltype and level must be specified when includeall is FALSE."
collegedata subsetcollegedata CONTROL controltype & LEVEL level
# Subset data for the specified institution
institutiondata subsetcollegedata INSTNM INSTNM
# Check if institution exists
if nrowinstitutiondata
stopInstitution not found in the specified control type and level."
# Adjust plot margins
parmar c
# Create multipanel plot
parmfrow clengthvariables
for variable in variables
# Check if variable exists in the dataset
if variable in namescollegedata
warningpasteVariable variable, "not found in the dataset. Skipping..."
next
histdata collegedatavariable
institutionvalue institutiondatavariable
# Plot histogram
histhistdata, main pasteHistogram of variable xlab variable,
ylab "Frequency", col "lightblue", border "black", ylim c maxhisthistdata, plot FALSE$counts
# Add vertical line for institution value
ablinev institutionvalue, col "blue", lwd
# Reset plotting parameters
parmfrow c
parmar c # Reset plot margins to default
#### Testing the plothistogram function
r
hist plothistogramUniversity of Alabama", includeall TRUE
Please do all of this in R and Python as simply as possible, without the use of any complex code and provide annotation which helps explain

Step by Step Solution
There are 3 Steps involved in it
Step: 1

Get Instant Access to Expert-Tailored Solutions
See step-by-step solutions with expert insights and AI powered tools for academic success
Step: 2

Step: 3

Ace Your Homework with AI
Get the answers you need in no time with our AI-driven, step-by-step assistance
Get Started


