Answered step by step
Verified Expert Solution
Link Copied!

Question

1 Approved Answer

Plot the break-even (normal profit) point and the horizontal price line that corresponds to the break-even point. Select which item you want to draw from

Plot the break-even (normal profit) point and the horizontal price line that corresponds to the break-even point.

Select which item you want to draw from the drop-down menu at the top of the graph to draw that item.
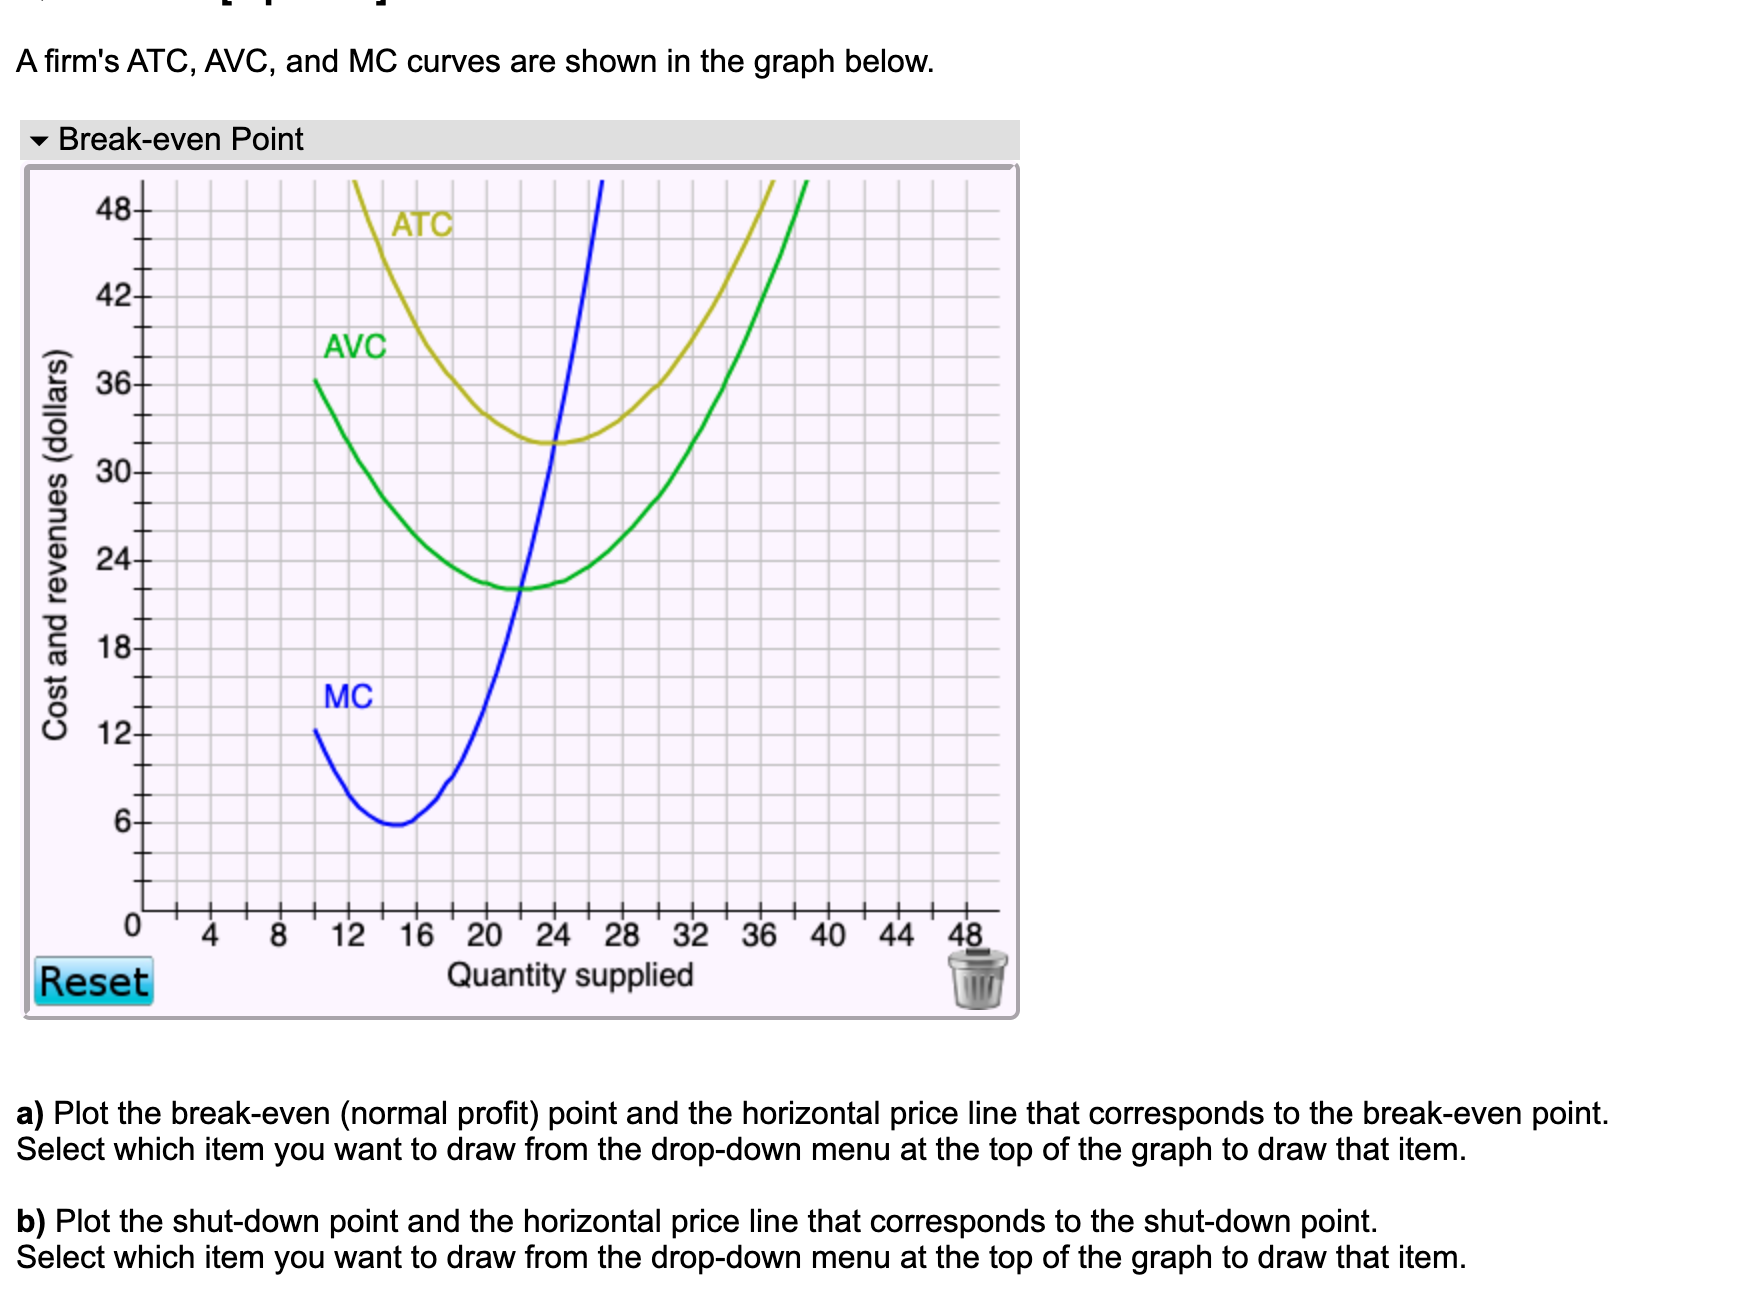
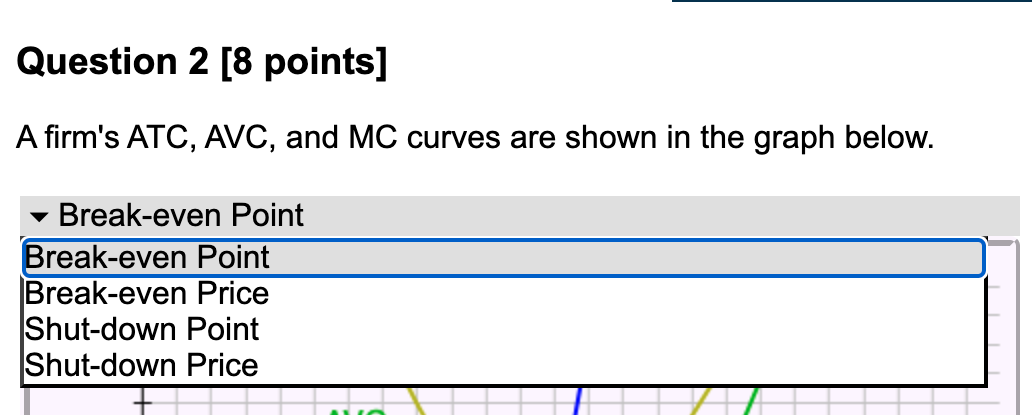
image text in transcribedimage text in transcribed
A firm's ATC, AVC, and MC curves are shown in the graph below. Break-even Point 48- 42- Cost and revenues (dollars) AVC 36- 30- 24- 18- MC 12- 8 12 16 20 24 28 32 36 40 44 48 Reset Quantity supplied a) Plot the break-even (normal profit) point and the horizontal price line that corresponds to the break-even point. Select which item you want to draw from the drop-down menu at the top of the graph to draw that item. b) Plot the shut-down point and the horizontal price line that corresponds to the shut-down point. Select which item you want to draw from the drop-down menu at the top of the graph to draw that item.Question 2 [8 points] A firm's ATC, AVC, and MC curves are shown in the graph below. Break-even Point Break-even Point Break-even Price Shut-down Point Shut-down Price

Step by Step Solution

There are 3 Steps involved in it

Step: 1

blur-text-image

Get Instant Access to Expert-Tailored Solutions

See step-by-step solutions with expert insights and AI powered tools for academic success

Step: 2

blur-text-image

Step: 3

blur-text-image

Ace Your Homework with AI

Get the answers you need in no time with our AI-driven, step-by-step assistance

Get Started

Recommended Textbook for

Managerial Economics and Business Strategy

Authors: Michael R. baye

7th Edition

978-0073375960, 71267441, 73375969, 978-0071267441

More Books

Students also viewed these Economics questions