

Answered step by step
Verified Expert Solution
Question
1 Approved Answer
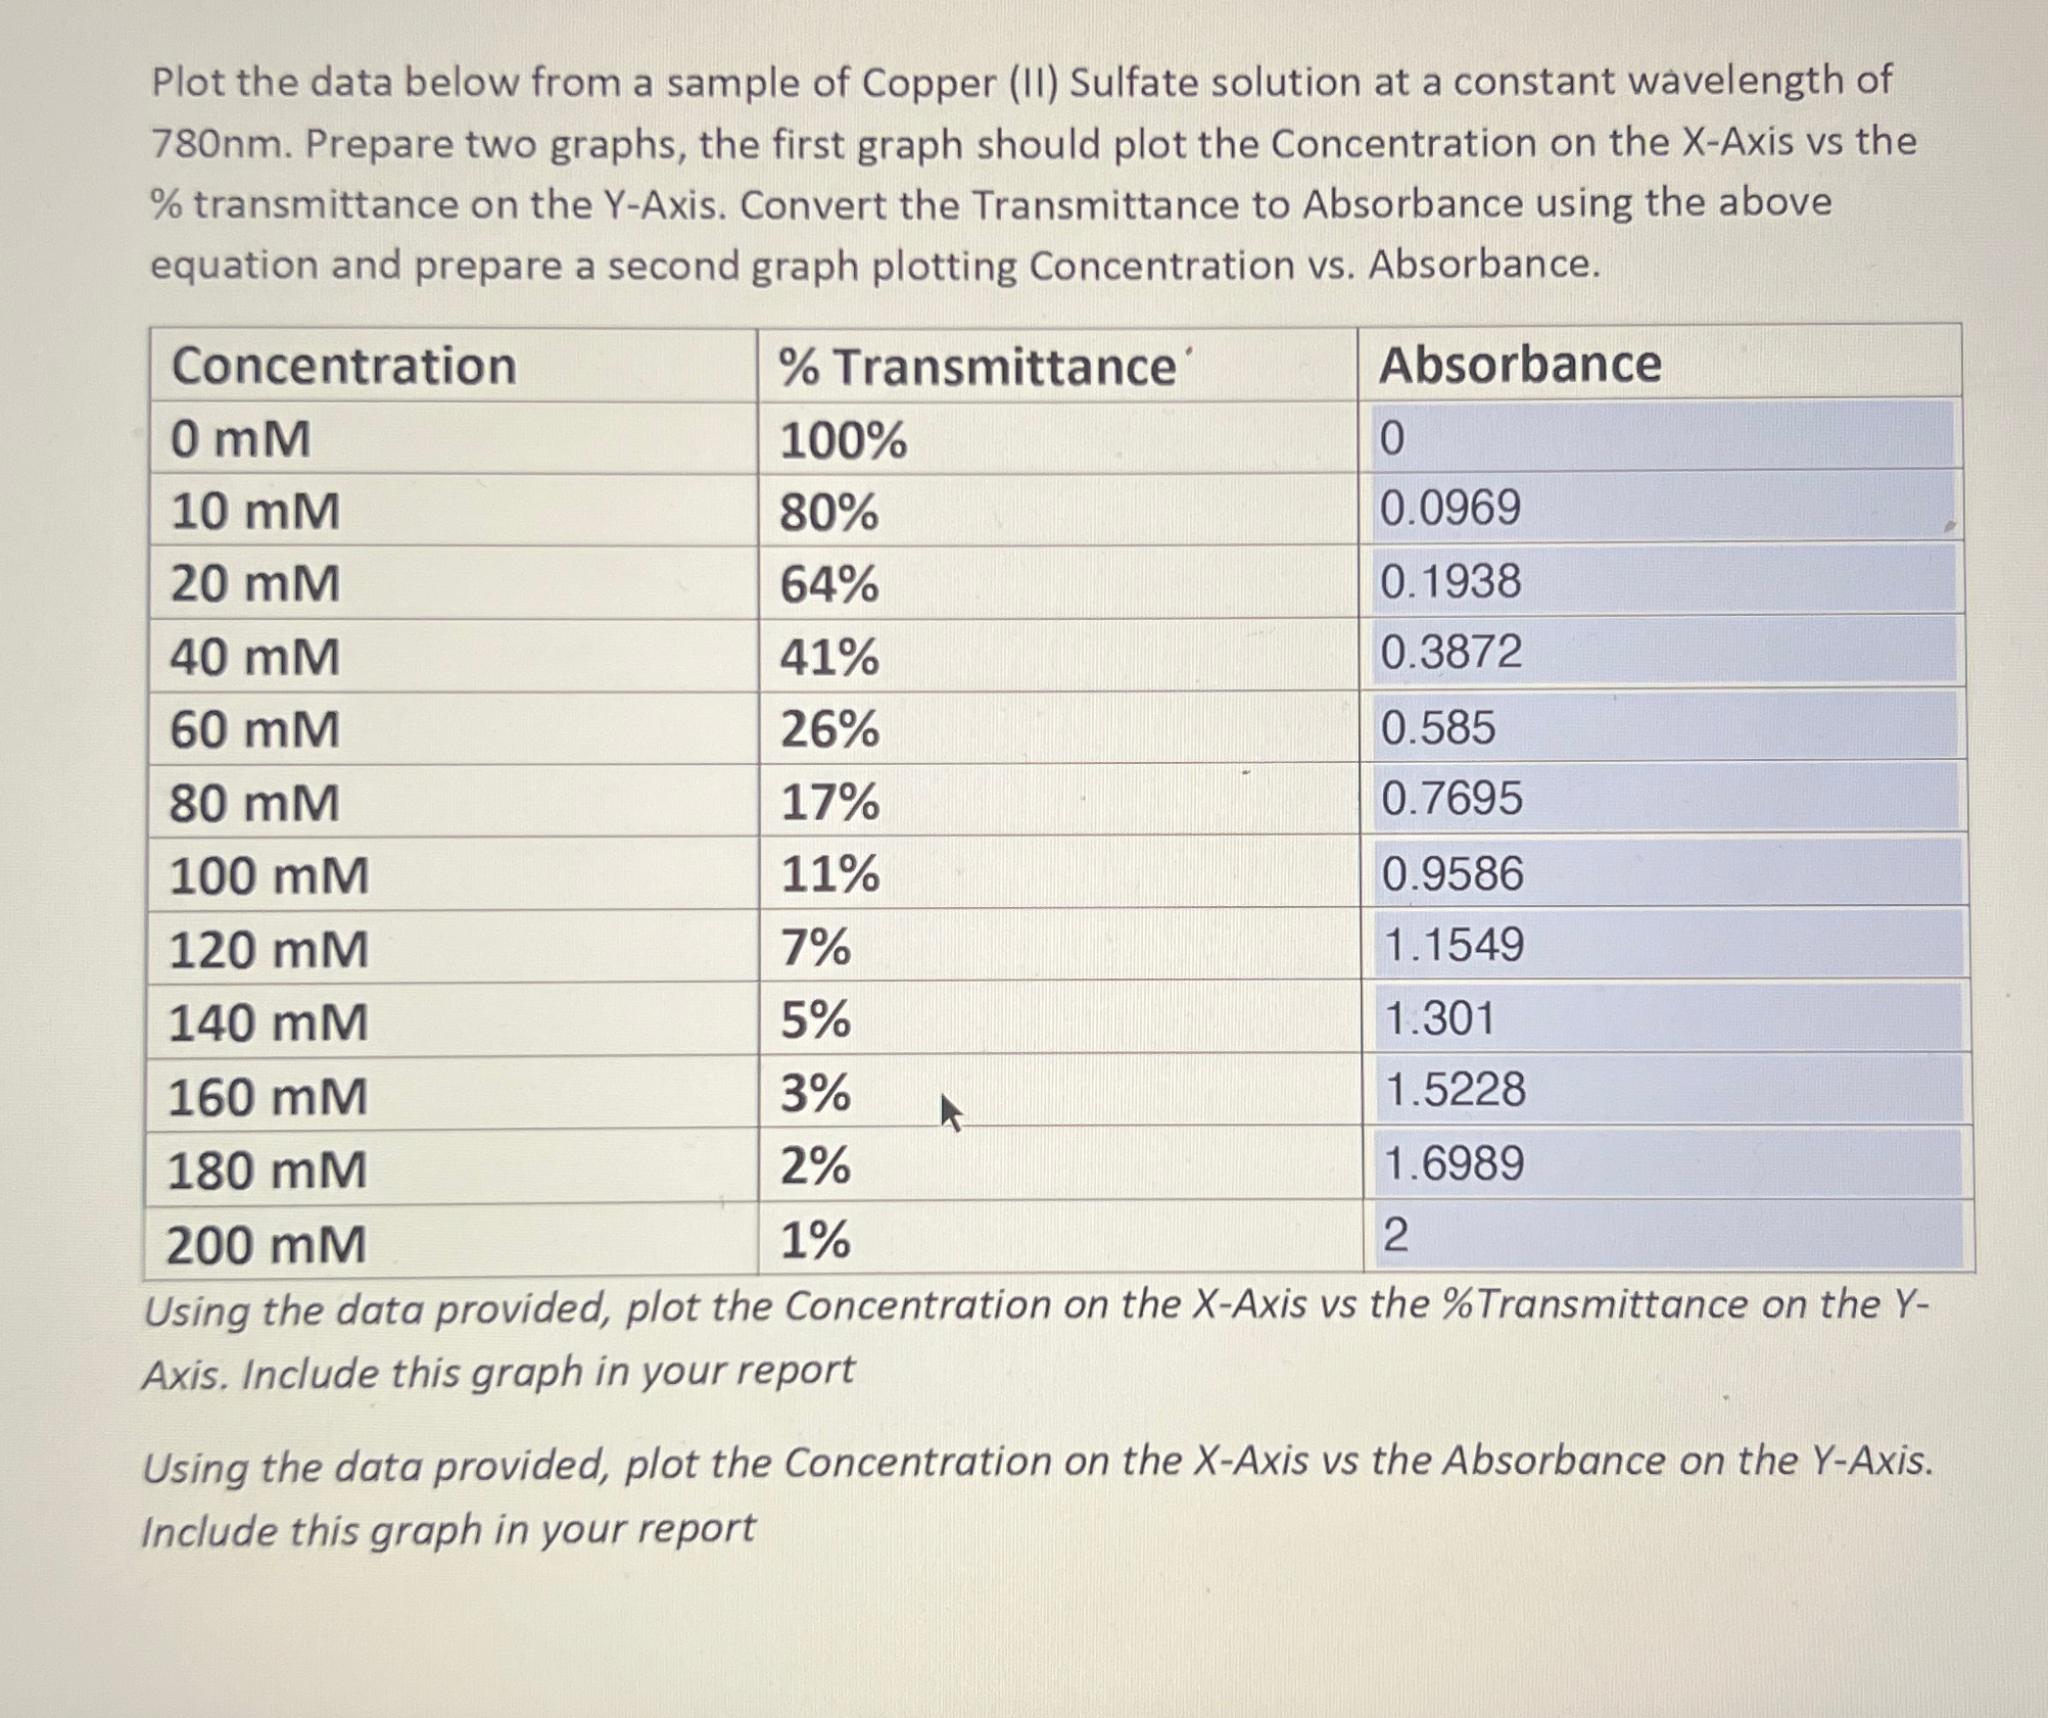
Plot the data below from a sample of Copper ( II ) Sulfate solution at a constant wavelength of 7 8 0 n m .
Plot the data below from a sample of Copper II Sulfate solution at a constant wavelength of Prepare two graphs, the first graph should plot the Concentration on the XAxis vs the transmittance on the YAxis. Convert the Transmittance to Absorbance using the above equation and prepare a second graph plotting Concentration vs Absorbance.
tableConcentration Transmittance,Absorbance
Using the data provided, plot the Concentration on the XAxis vs the Transmittance on the Axis. Include this graph in your report
Using the data provided, plot the Concentration on the XAxis vs the Absorbance on the YAxis. Include this graph in your report. GRAPH MUST BE DONE ON EXCEL
Step by Step Solution
There are 3 Steps involved in it
Step: 1

Get Instant Access to Expert-Tailored Solutions
See step-by-step solutions with expert insights and AI powered tools for academic success
Step: 2

Step: 3
Ace Your Homework with AI
Get the answers you need in no time with our AI-driven, step-by-step assistance
Get Started
Introductory Chemistry version 1.0
Authors: David W. Ball
1st edition
1453327657, 978-1453327654