Answered step by step
Verified Expert Solution
Question
1 Approved Answer
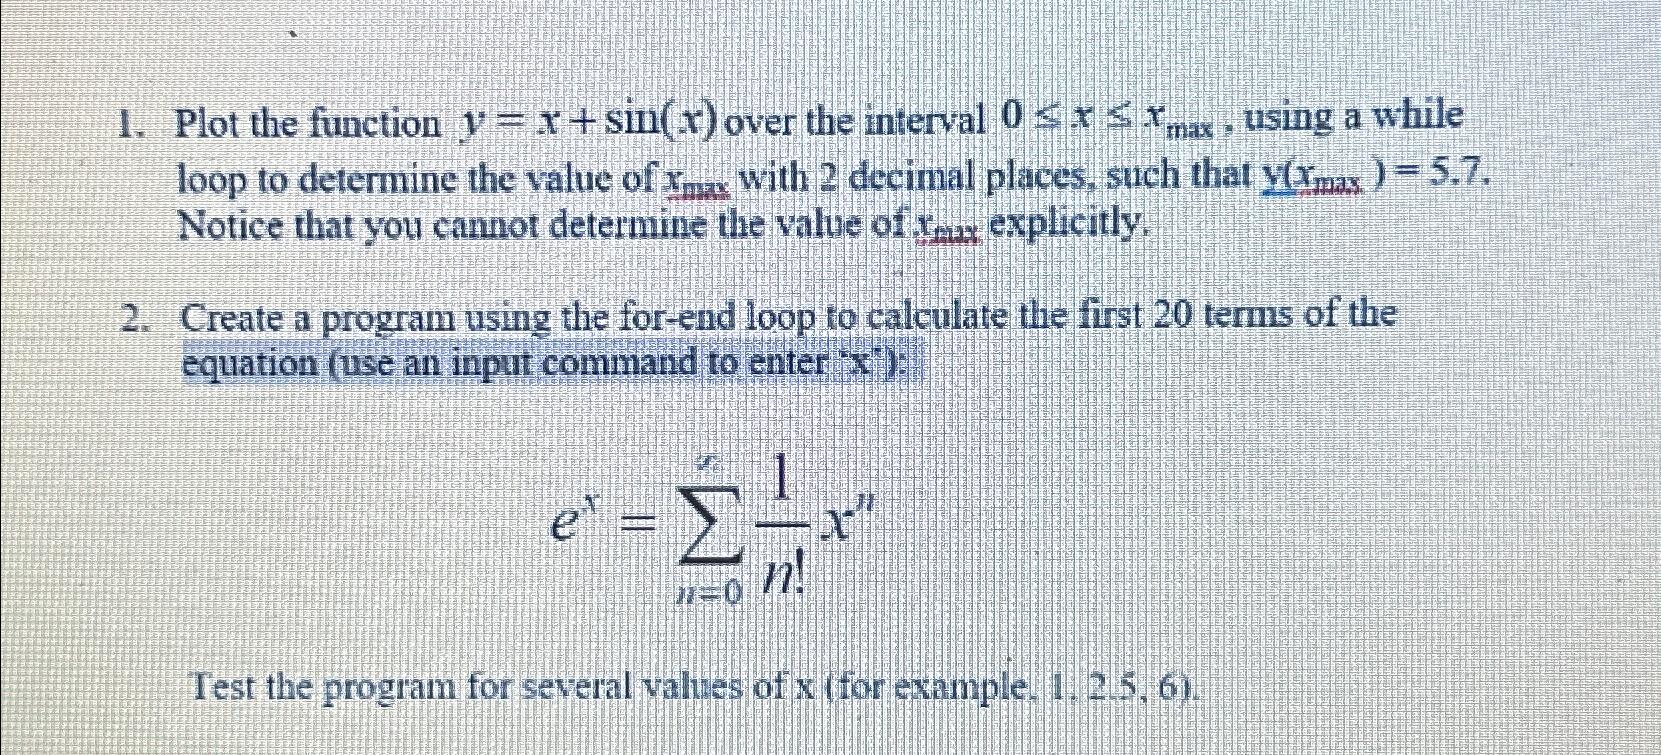
Plot the function y = x + s i n ( x ) over the interval 0 x x m a x , using a
Plot the function over the interval using a while loop to determine the value of with decimal places, such that Notice that you cannot determine the value of max explicitly.
Create a program using the forend loop to calculate the first terms of the equation use an input command to enter ::
Test the program for several values of for example,

Step by Step Solution
There are 3 Steps involved in it
Step: 1

Get Instant Access to Expert-Tailored Solutions
See step-by-step solutions with expert insights and AI powered tools for academic success
Step: 2

Step: 3

Ace Your Homework with AI
Get the answers you need in no time with our AI-driven, step-by-step assistance
Get Started


