

Question: Plot the graphs of x, x, x, x, and x over the interval [0, 1] within the same figure window using 2000 points as
![Plot the graphs of x,x, , x?, and x over the interval [0, 1] within the same figure window using 2000 points as follows. ? Ge](https://dsd5zvtm8ll6.cloudfront.net/si.experts.images/questions/2022/08/6308bfb14ac3d_7446308bfb0e34a6.jpg)
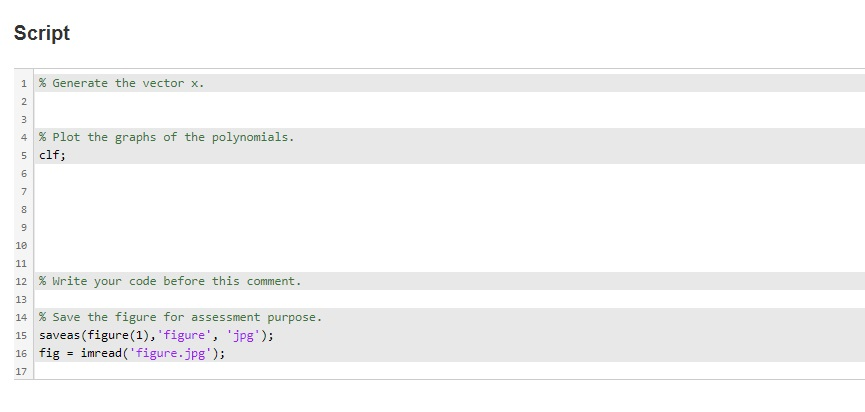
Plot the graphs of x, x, x, x, and x over the interval [0, 1] within the same figure window using 2000 points as follows. Generate the domain in a vector x. Plot the graphs of x, x, x, x7, and x with the aid of the vector x. Give the legends to the graphs. Give the title 'odd powers of x' to the plot. Label the x- and the y-axes using 'x' and 'y'. You may have to run the pretest more than once even if your plot is correct. Your plot should look as follows: 0.9 0.8 0.7 0.6 0.5 0.4 0.3 0.2 0.1 0 0 0.1 0.2 0.3 odd powers of x 0.4 0.5 X 0.6 0.7 L 0.8 0.9 1 Script 1 % Generate the vector x. 2 W N 3 4% Plot the graphs of the polynomials. 5 clf; 567 8 9 10 11 12 % Write your code before this comment. 13 14 % Save the figure for assessment purpose. 15 saveas (figure (1), 'figure', 'jpg'); 16 fig imread('figure.jpg'); 17
Step by Step Solution
3.41 Rating (148 Votes )
There are 3 Steps involved in it
To accomplish this task in MATLAB follow these steps to fill in the script 1 Generate the vector x C... View full answer

Get step-by-step solutions from verified subject matter experts