

Answered step by step
Verified Expert Solution
Question
1 Approved Answer
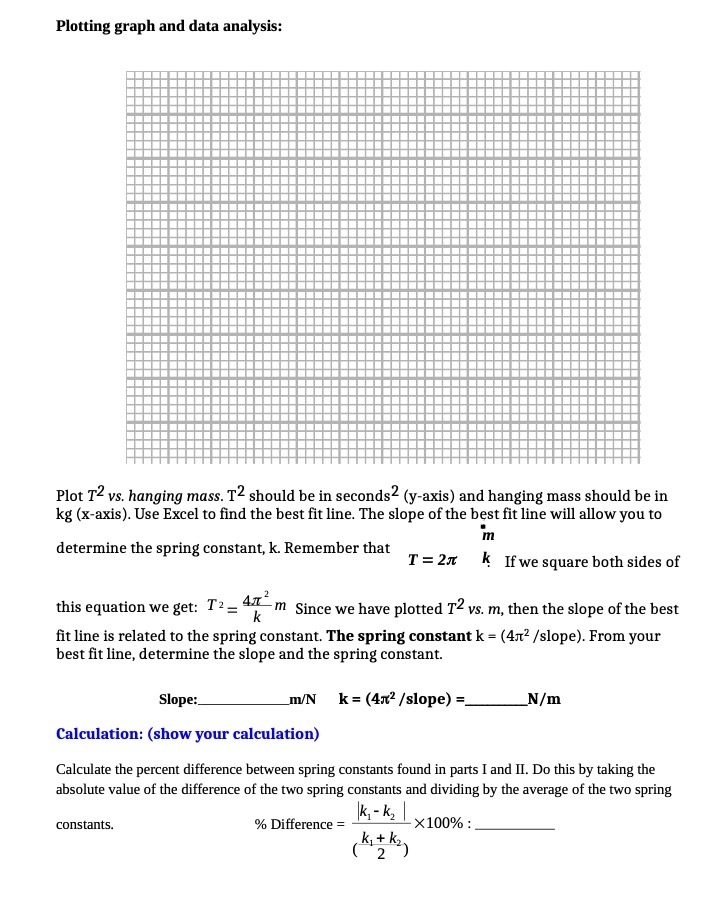
Plotting graph and data analysis: Plot T2 vs. hanging mass. T2 should be in seconds (y-axis) and hanging mass should be in kg (x-axis). Use
Step by Step Solution
There are 3 Steps involved in it
Step: 1

Get Instant Access to Expert-Tailored Solutions
See step-by-step solutions with expert insights and AI powered tools for academic success
Step: 2

Step: 3
Ace Your Homework with AI
Get the answers you need in no time with our AI-driven, step-by-step assistance
Get Started
Thermal Physics
Authors: Charles Kittel, Herbert Kroem
2nd Edition
716710889, 978-0716710882