Answered step by step
Verified Expert Solution
Question
1 Approved Answer
Plotting sines and cosines as a function of time (and phase angles) Consider the cosine wave x(t) = 3 cos(10mt) , wheret = seconds 1)
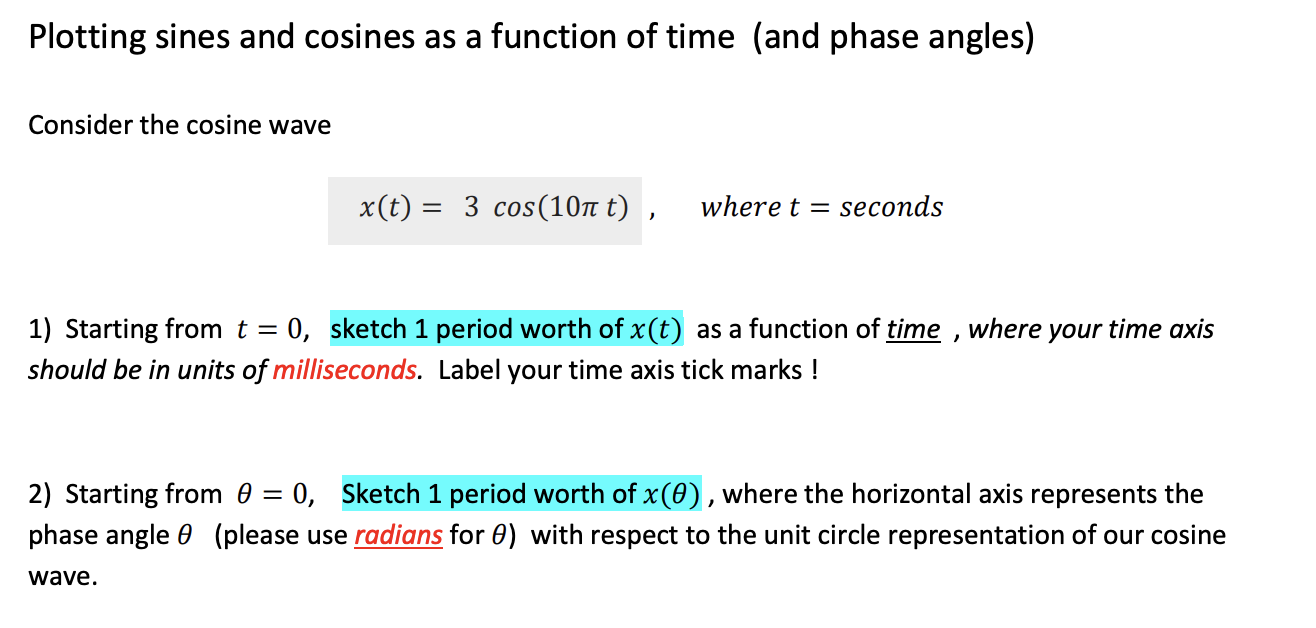
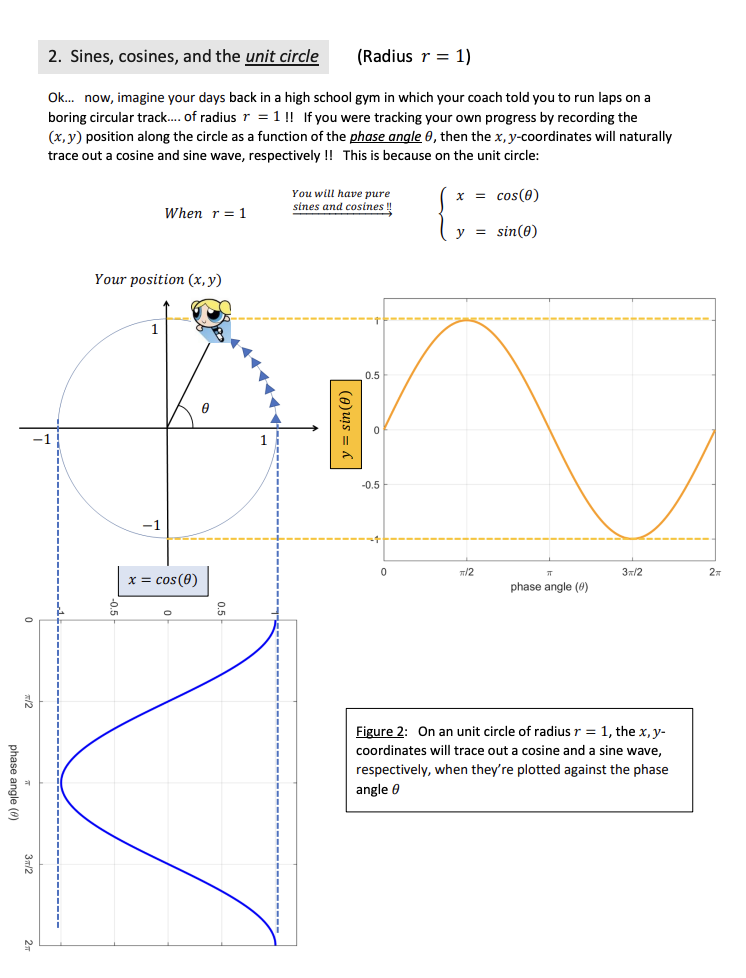
Plotting sines and cosines as a function of time (and phase angles) Consider the cosine wave x(t) = 3 cos(10mt) , wheret = seconds 1) Starting from t = 0, sketch 1 period worth of x(t) as a function of time , where your time axis should be in units of milliseconds. Label your time axis tick marks ! 2) Starting from 8 = 0, Sketch 1 period worth of x(8) , where the horizontal axis represents the phase angle 8 (please use radians for 8) with respect to the unit circle representation of our cosine wave. 2. Sines, cosines, and the unit circle (Radius r = 1) OK... now, imagine your days back in a high school gym in which your coach told you to run laps on a boring circular track.. of radius r = 1 !! If you were tracking your own progress by recording the (x, y) position along the circle as a function of the phase angle 0, then the x, y-coordinates will naturally trace out a cosine and sine wave, respectively !! This is because on the unit circle: You will have pure X = cos(0) When r = 1 sines and cosines !! y sin(0) Your position (x, y) 0.5 y = sin(0) 0 1 0.5 0 7/2 3x/2 x = cos (0) phase angle (0) 9'0- C Figure 2: On an unit circle of radius r = 1, the x, y- coordinates will trace out a cosine and a sine wave, respectively, when they're plotted against the phase phase angle (8) angle 0 3x/2
Step by Step Solution
There are 3 Steps involved in it
Step: 1
Get Instant Access to Expert-Tailored Solutions
See step-by-step solutions with expert insights and AI powered tools for academic success
Step: 2
Step: 3
Ace Your Homework with AI
Get the answers you need in no time with our AI-driven, step-by-step assistance
Get Started