pls provide the full and correct answers for the following two questions
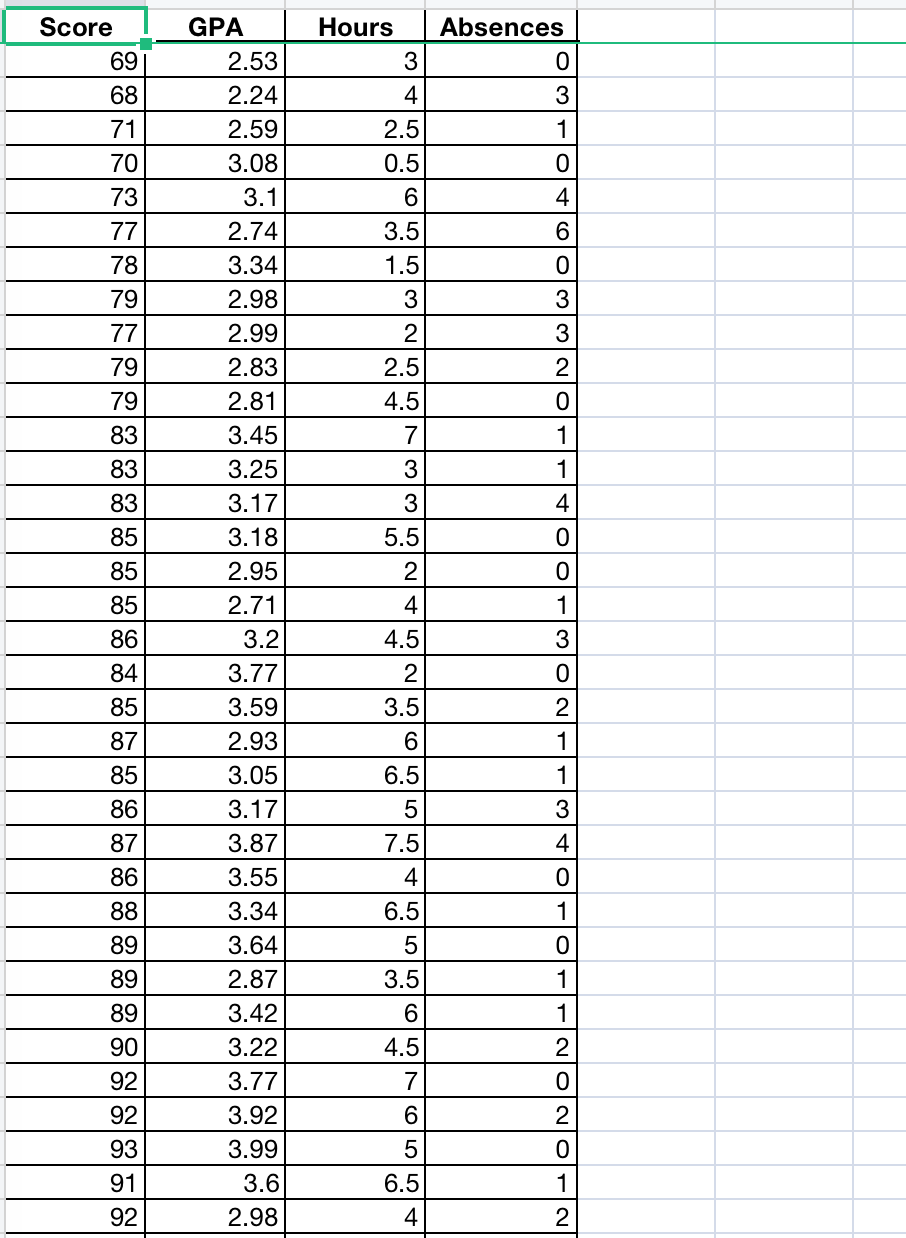
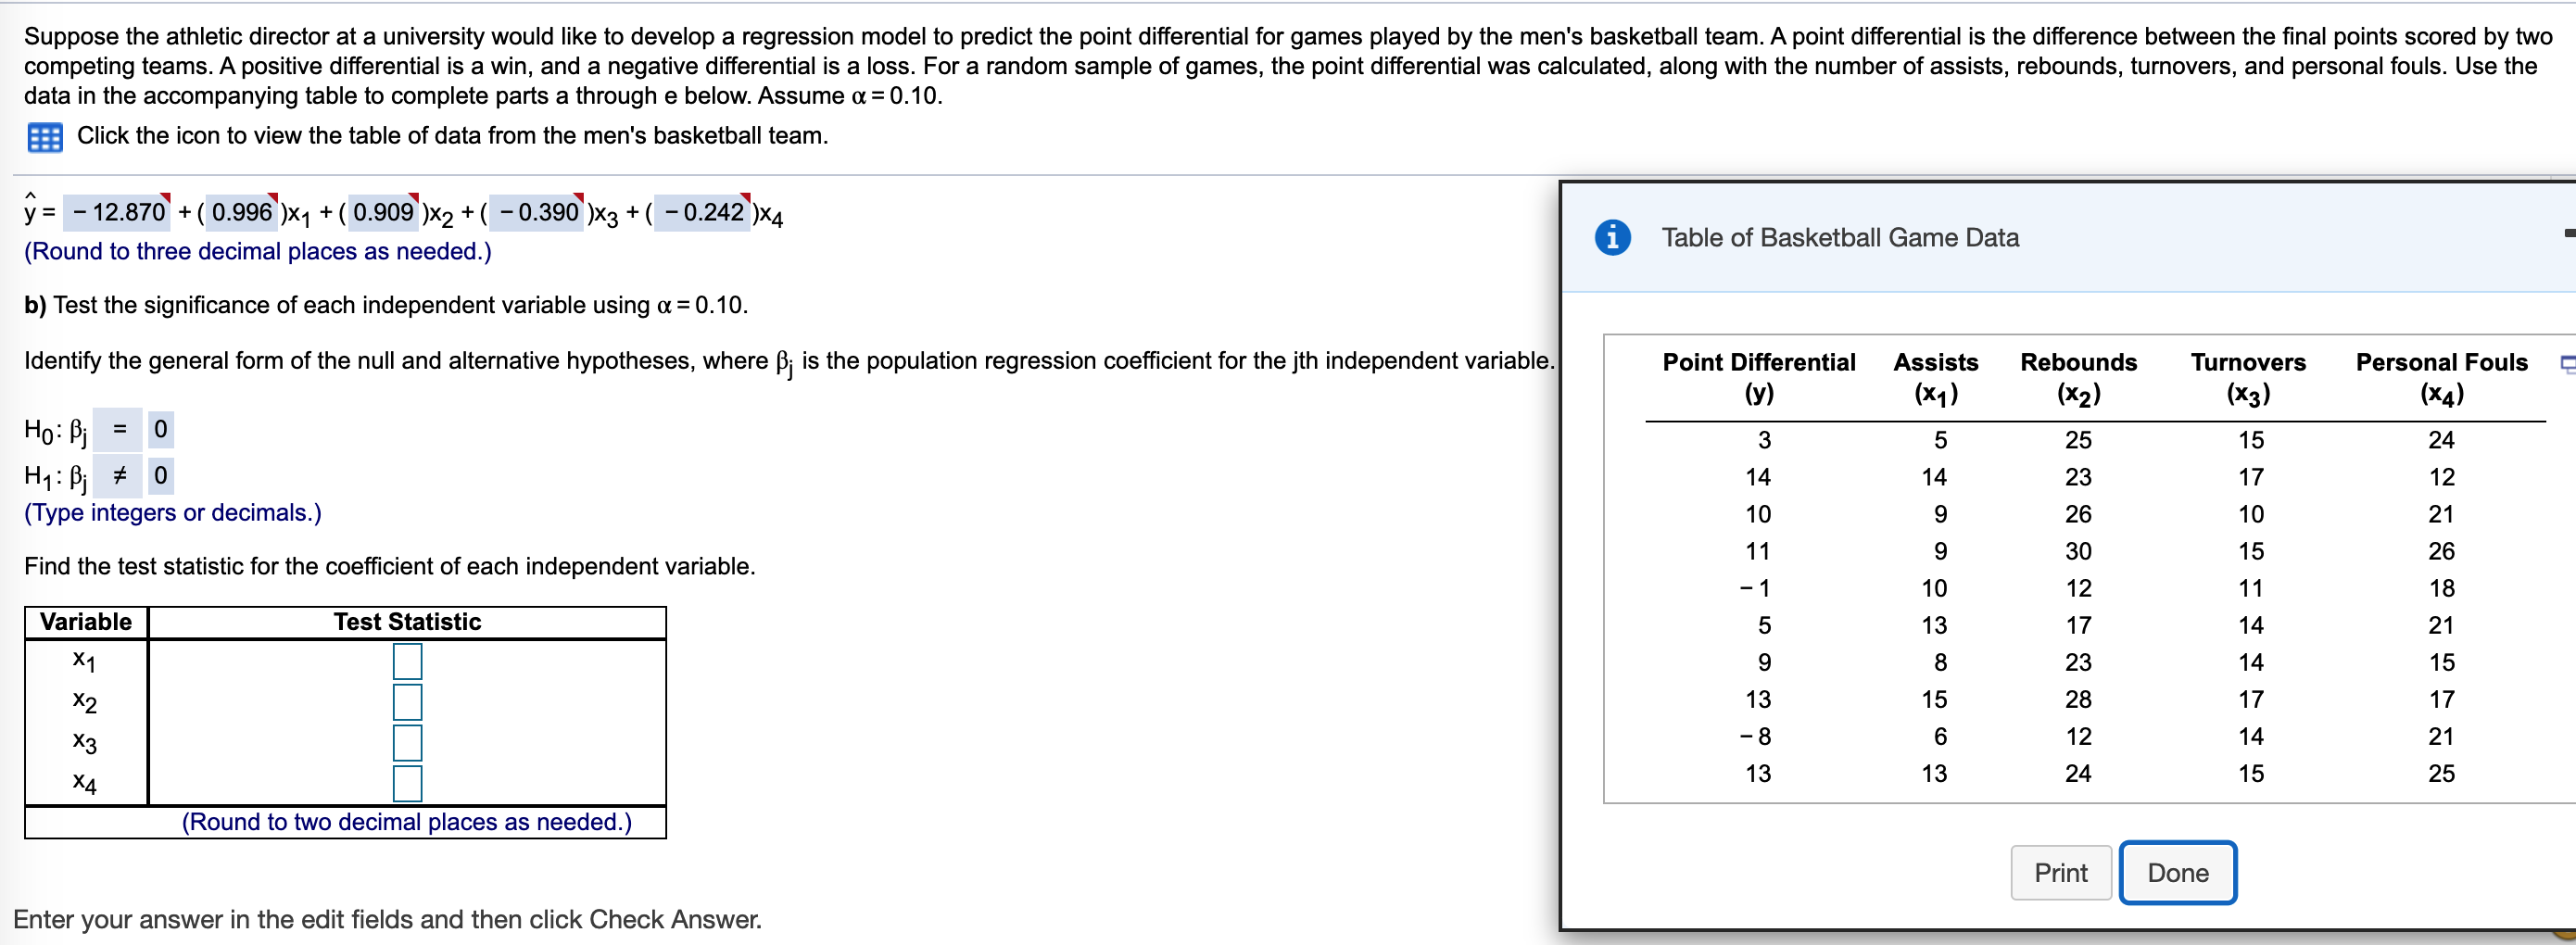
A business statistics professor at a college would like to develop a regression model to predict the final exam scores for students based on their current GPAs, the number of hours they studied for the exam, and the number of times they were absent during the semester. The data for these variables are in the accompanying table. Complete parts a through d below. Click the icon to view the table of data. a. Construct a regression model using all three independent variables. Let y be the final exam scores, x, be the GPAs, X2 be the number of hours spent studying, and X3 be the number of absences during the semester. y= (0) +() *1 + ()*2+ ()*3 (Round to three decimal places as needed.)Score GPA Hours Absences 69 2.53 3 O 68 2.24 4 3 71 2.59 2.5 70 3.08 0.5 0 73 3.1 6 77 2.74 3.5 6 78 3.34 1.5 0 79 2.98 3 3 77 2.99 2 3 79 2.83 2.5 ON 79 2.81 4.5 83 3.45 7 83 3.25 3 83 3.17 3 85 3.18 5.5 85 2.95 2 85 2.71 4 - NOW - O O A - 86 3.2 4.5 84 3.77 2 85 3.59 3.5 87 2.93 6 85 3.05 6.5 86 3.17 5 87 3.87 7.5 86 3.55 4 88 3.34 6.5 | - 89 3.64 5 O 89 2.87 3.5 - 89 3.42 6 90 3.22 4.5 92 3.77 7 ONON 92 3.92 93 3.99 5 91 3.6 6.5 N - 92 2.98 436 92 2.98 4 37 94 3.26 6.5 0 38 99 2.87 3.5 0 39 100 3.73 5 40 100 3.48 6.5 41 101 3.02 7 0 42Suppose the athletic director at a university would like to develop a regression model to predict the point differential for games played by the men's basketball team. A point differential is the difference between the final points scored by two competing teams. A positive differential is a win, and a negative differential is a loss. For a random sample of games, the point differential was calculated, along with the number of assists, rebounds, turnovers, and personal fouls. Use the data in the accompanying table to complete parts a through e below. Assume a = 0.10. Click the icon to view the table of data from the men's basketball team. y= - 12.870 + ( 0.996 )x1 + ( 0.909 )x2 + ( -0.390 )x3 + ( -0.242 )x4 i Table of Basketball Game Data (Round to three decimal places as needed.) b) Test the significance of each independent variable using a = 0.10. Identify the general form of the null and alternative hypotheses, where Bj is the population regression coefficient for the jth independent variable. Point Differential Assists Rebounds Turnovers Personal Fouls (y) (X 1 ) (x2) (X3) (x4) Ho: Bi = 0 3 5 25 15 24 H1 : Bi # 0 14 14 23 17 12 (Type integers or decimals.) 10 26 10 21 11 30 15 26 Find the test statistic for the coefficient of each independent variable. -1 10 12 11 18 Variable Test Statistic 5 13 17 14 21 8 23 14 15 X1 15 X2 28 17 17 12 14 21 X3 13 24 15 25 X4 Round to two decimal places as needed.) Print Done Enter your answer in the edit fields and then click Check


