Thank u
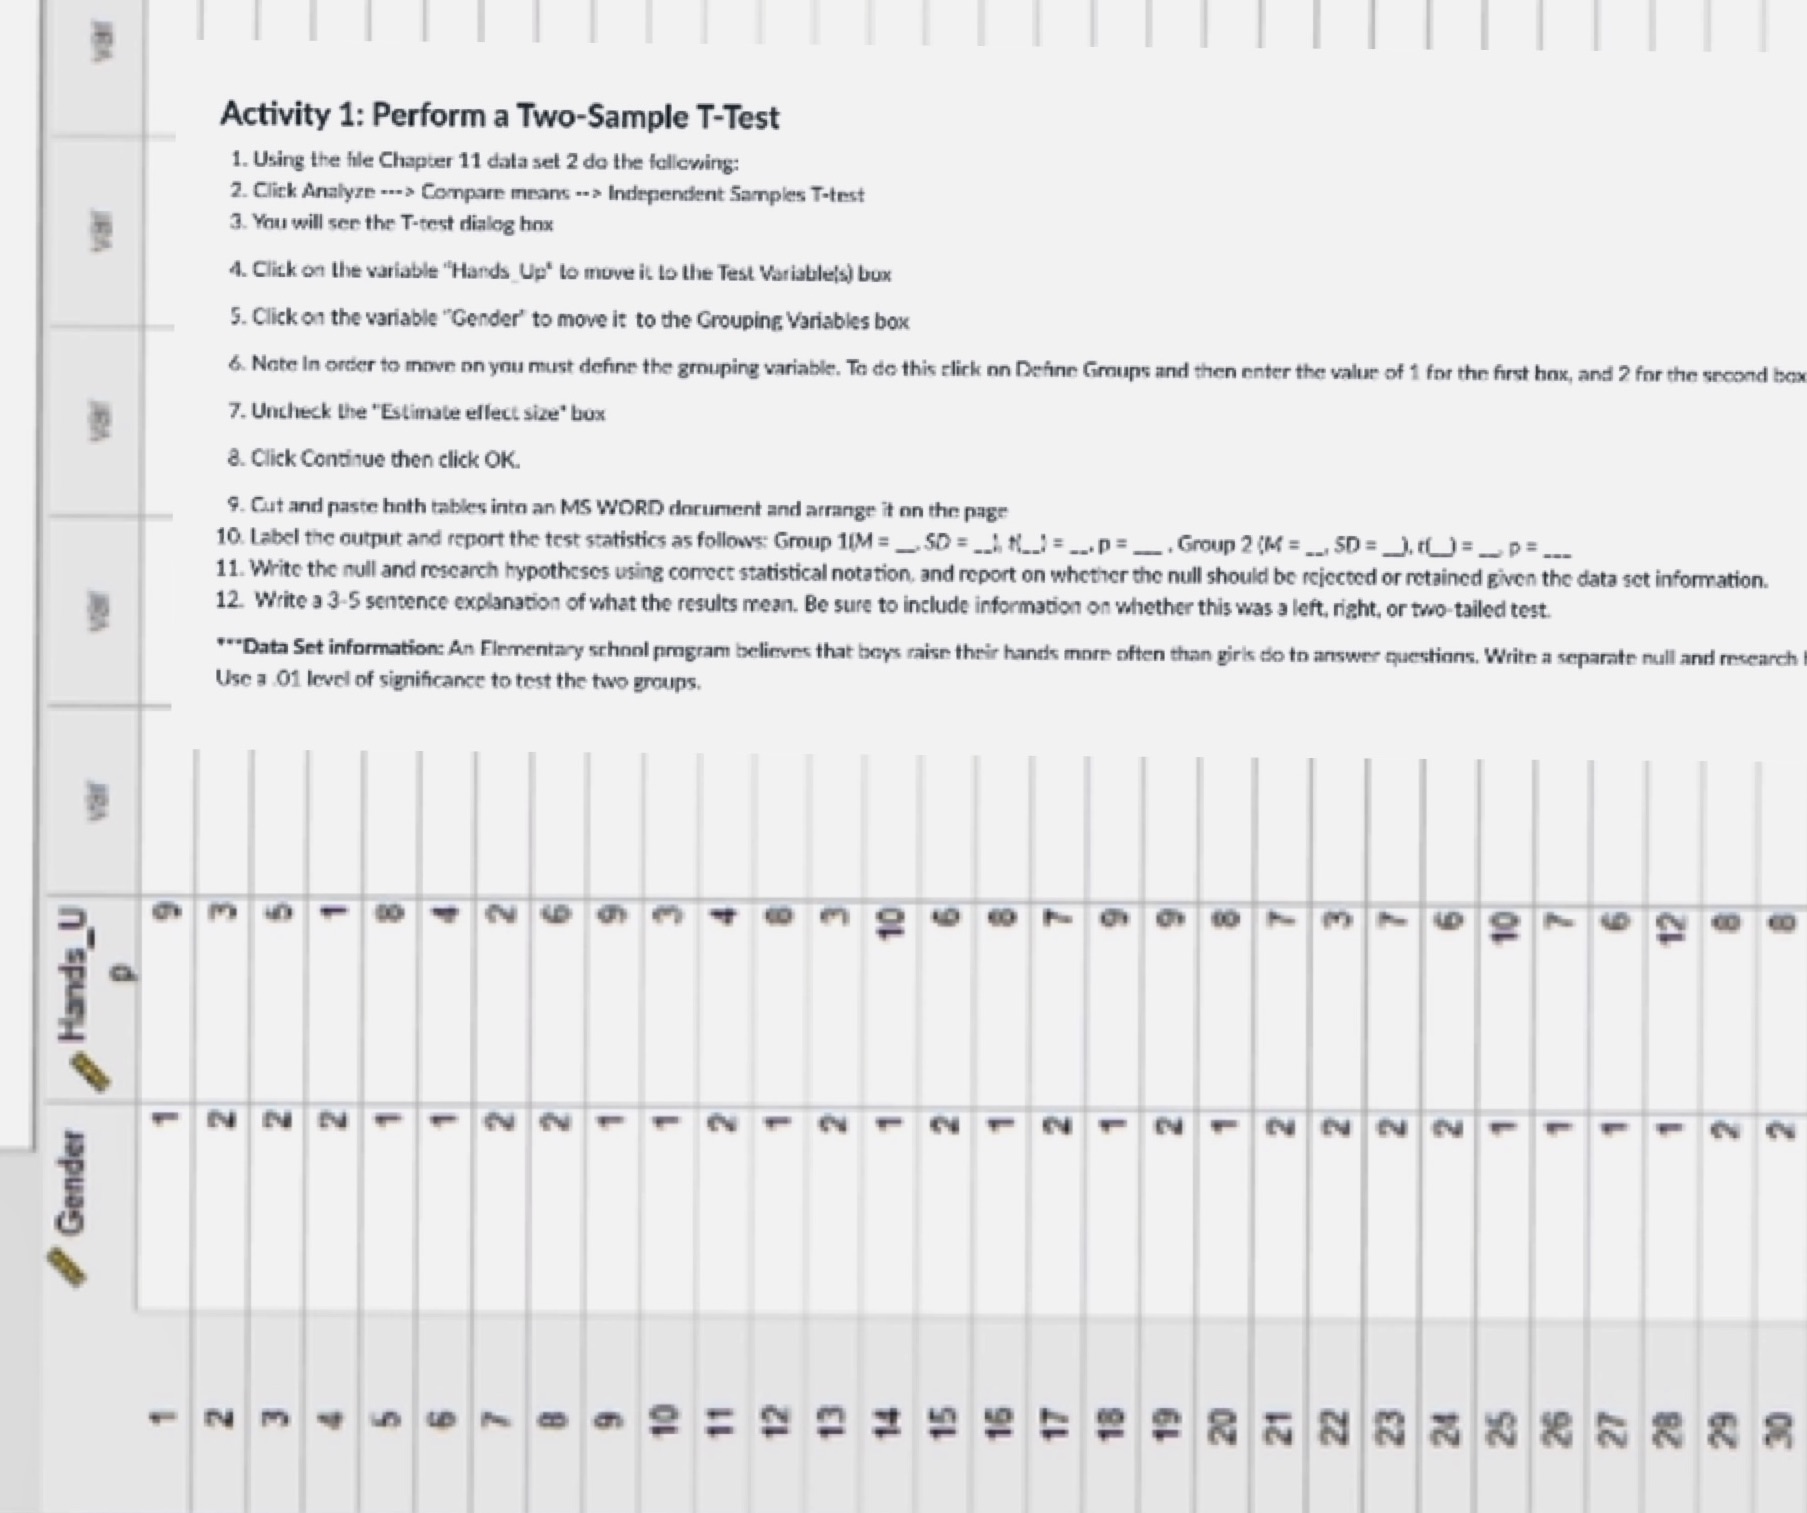
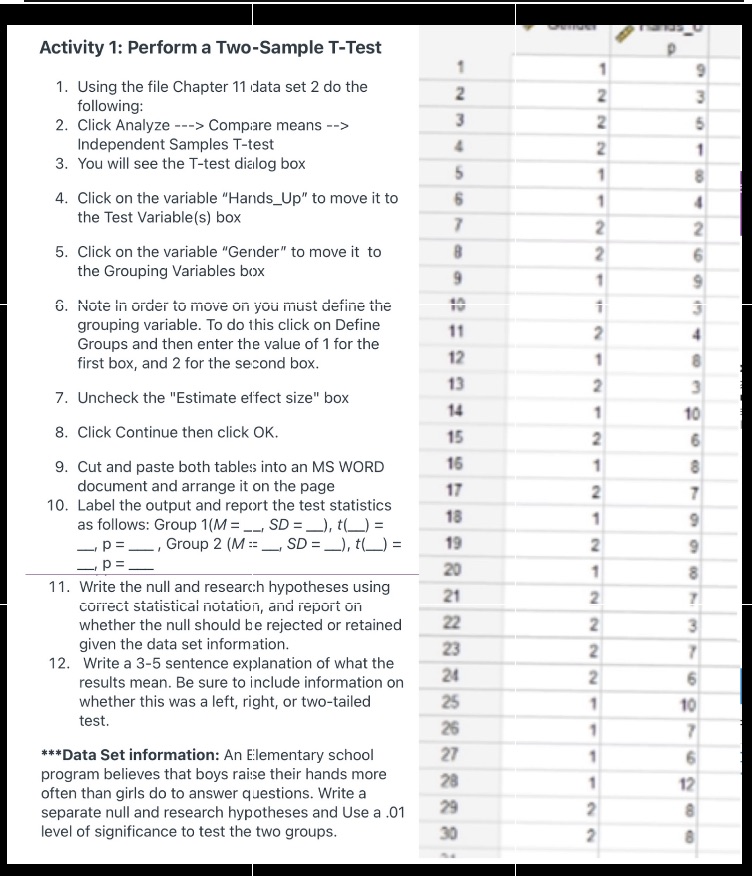
Activity 1: Perform a Two-Sample T-Test 1. Using the file Chapter 11 data set 2 do the following: 2. Click Analyze ..-> Compare means .-> Independent Samples T-test 3. You will see the T-test dialog hox 4. Click on the variable "Hands Up" to move it to the Test Variable(s) bux 5. Click on the variable "Gender" to move it to the Grouping Variables box 6. Note In order to move on you must define the grouping variable. To do this click on Define Groups and then enter the value of 1 for the first box, and 2 for the second box 7. Uncheck the "Estimate effect size" box 8. Click Continue then click OK. 9. Cut and paste hoth tables into an MS WORD document and arrange it on the page 10. Label the output and report the test statistics as follows: Group 1IM= _SD= _) ()=...p= _. Group 2 (M = __. SD=_.(()= _ p= _.. 11. Write the null and research hypotheses using correct statistical notation, and report on whether the null should be rejected or retained given the data set information. 12. Write a 3-5 sentence explanation of what the results mean. Be sure to include information on whether this was a left, right, or two-tailed test ""Data Set information: An Elementary school program believes that boys raise their hands more often than girls do to answer questions. Write a separate null and research Use a .01 level of significance to test the two groups. warr Hands_U FNNNF NN IN FNFNNNNF NN GenderActivity 1: Perform a Two-Sample T-Test 1. Using the file Chapter 11 data set 2 do the following: O W 2. Click Analyze ---> Compare means --> Independent Samples T-test 3. You will see the T-test dialog box 00 4. Click on the variable "Hands_Up" to move it to the Test Variable(s) box 5. Click on the variable "Gender" to move it to the Grouping Variables box G. Note in order to move on you must define the grouping variable. To do this click on Define 11 Groups and then enter the value of 1 for the first box, and 2 for the second box. 12 13 NNNNNNJJJNINJANNJONNN 7. Uncheck the "Estimate effect size" box 14 8. Click Continue then click OK. 15 9. Cut and paste both tables into an MS WORD 16 document and arrange it on the page 17 10. Label the output and report the test statistics 18 as follows: Group 1(M = __, SD = _), (() = - P=_ Group 2 (M = _, SD = _), () = 19 - P =_ 20 11. Write the null and research hypotheses using 21 correct statistical notation, and report on whether the null should be rejected or retained 22 given the data set information. 23 12. Write a 3-5 sentence explanation of what the results mean. Be sure to include information on 24 whether this was a left, right, or two-tailed 25 test. 26 ***Data Set information: An Elementary school 27 program believes that boys raise their hands more 28 often than girls do to answer questions. Write a separate null and research hypotheses and Use a .01 29 level of significance to test the two groups. 30 N


