

Answered step by step
Verified Expert Solution
Question
1 Approved Answer
pls show working hw_lect9_2: Consider Example 3.1 (done in lecture 8), where an engineer is interested in determining how different RF power settings on a
pls show working
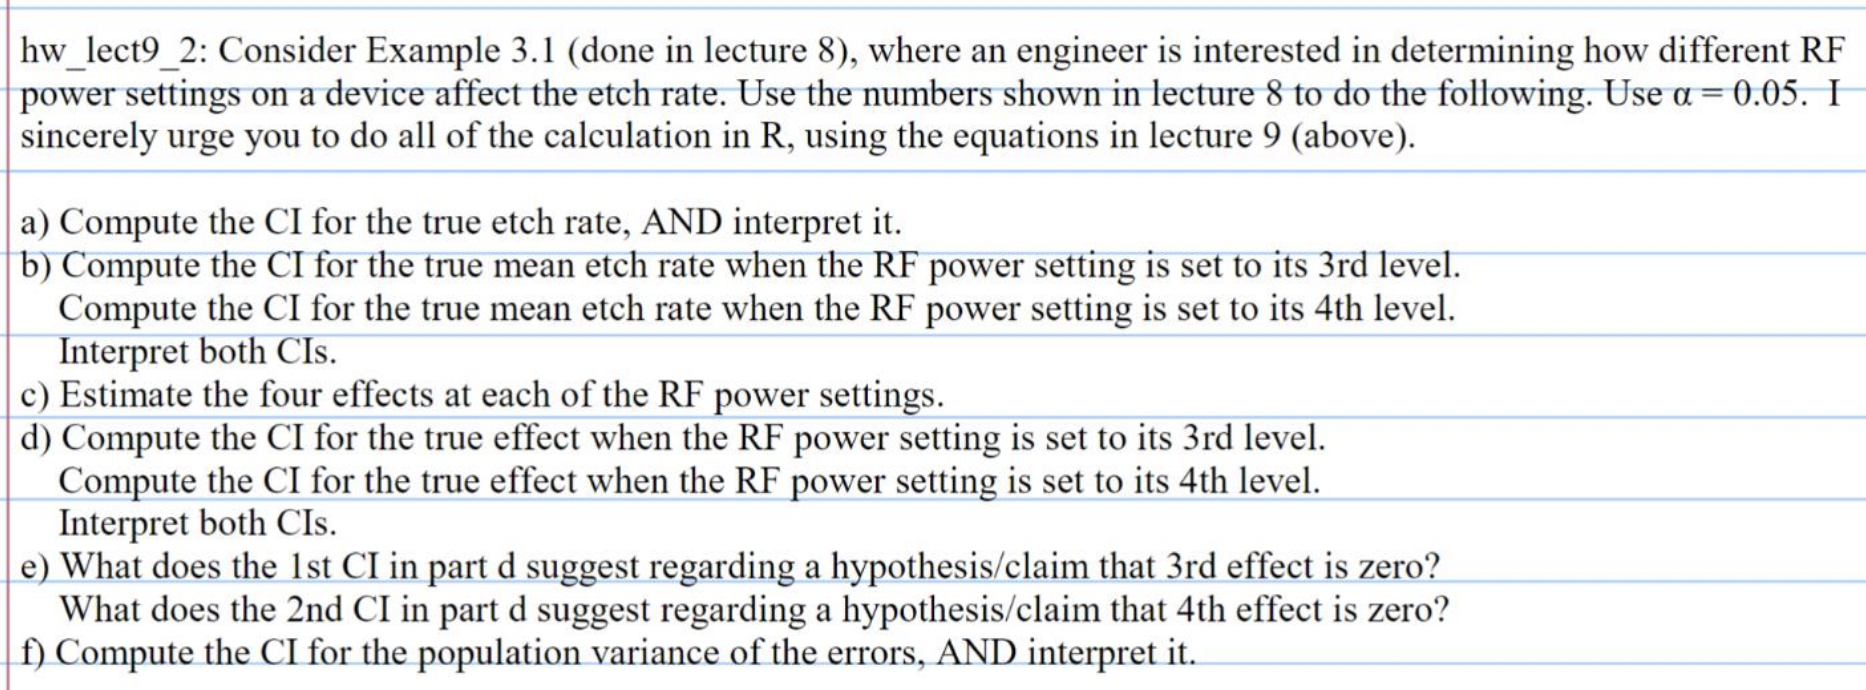
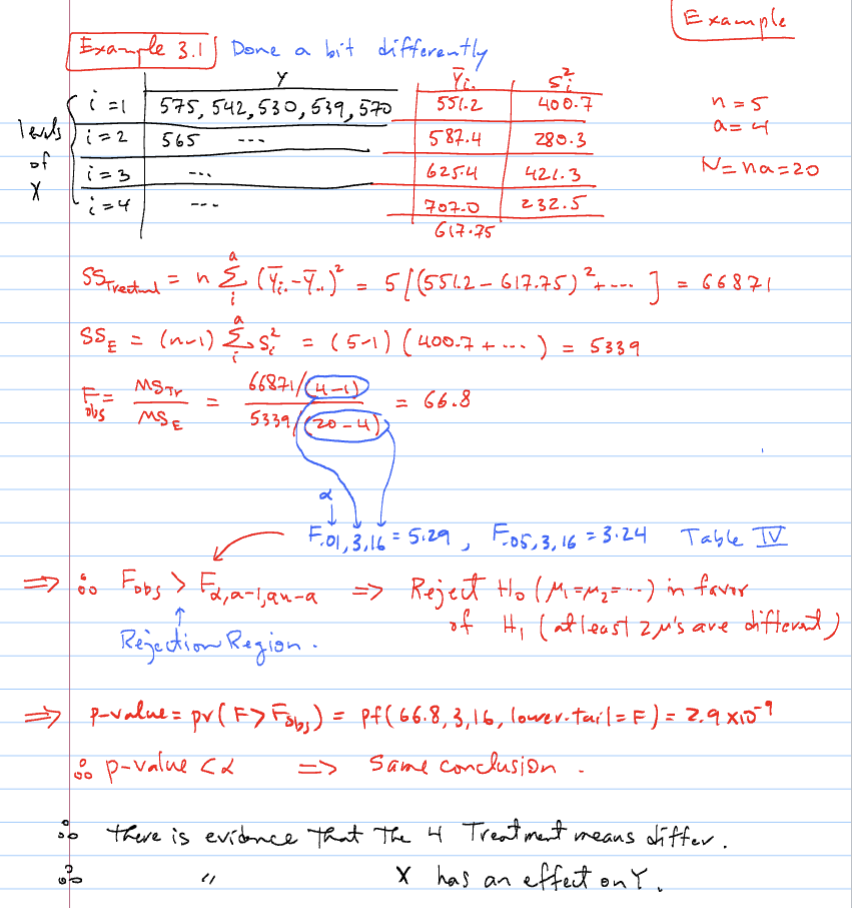
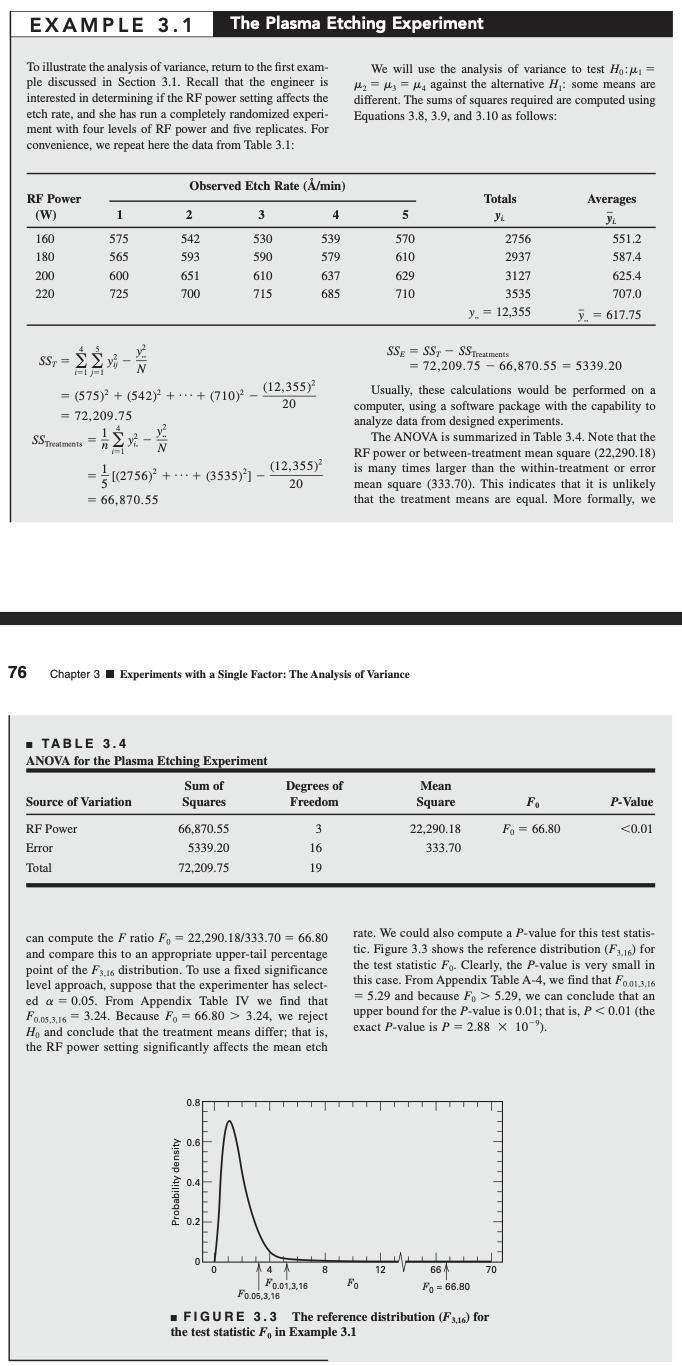
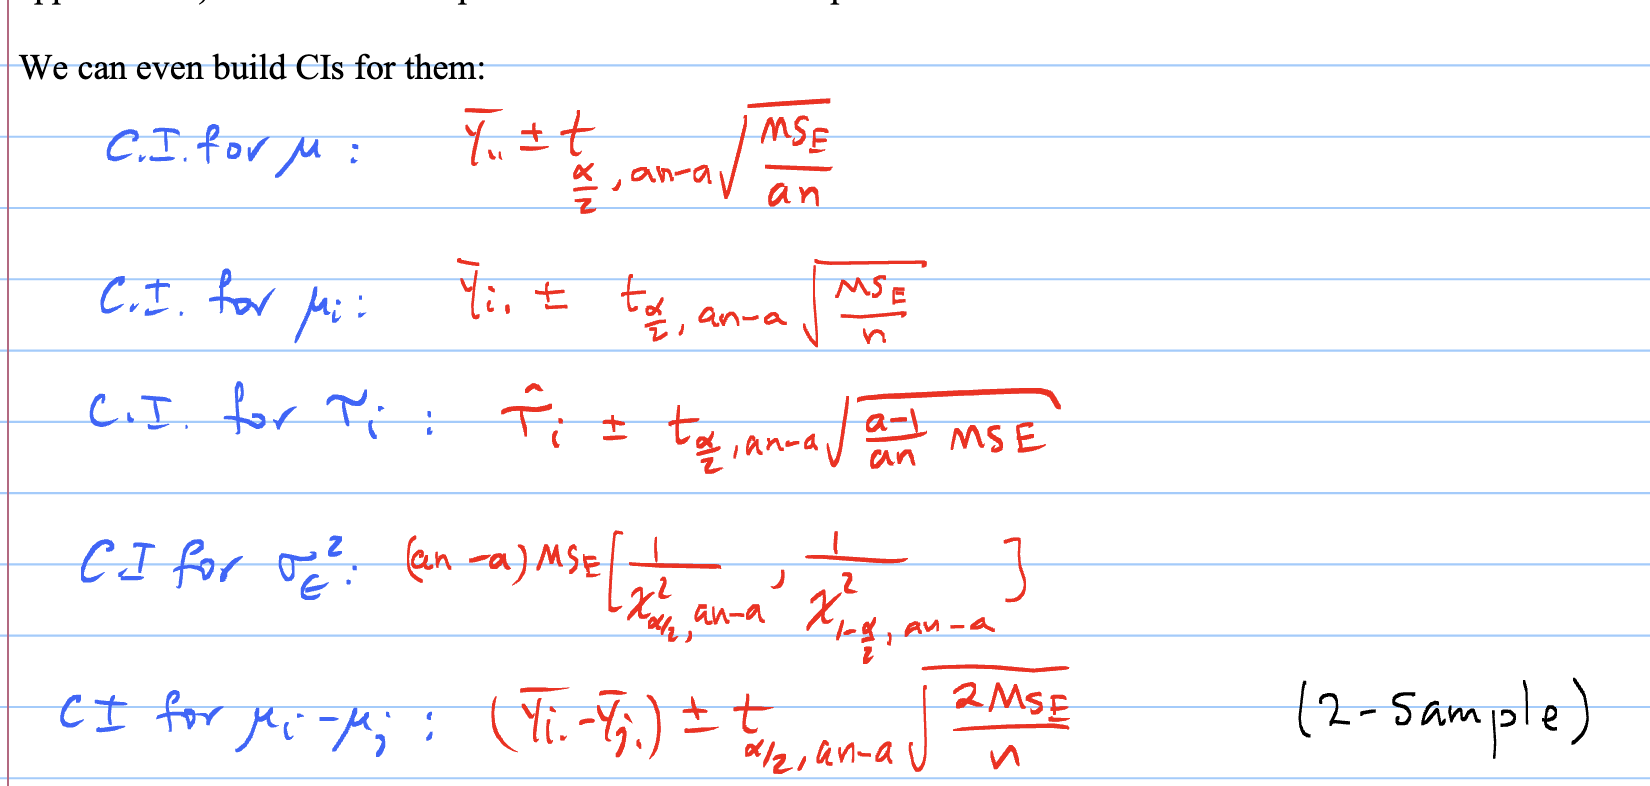 hw_lect9_2: Consider Example 3.1 (done in lecture 8), where an engineer is interested in determining how different RF power settings on a device affect the etch rate. Use the numbers shown in lecture 8 to do the following. Use =0.05. I sincerely urge you to do all of the calculation in R, using the equations in lecture 9 (above). a) Compute the CI for the true etch rate, AND interpret it. b) Compute the CI for the true mean etch rate when the RF power setting is set to its 3rd level. Compute the CI for the true mean etch rate when the RF power setting is set to its 4 th level. Interpret both CIs. c) Estimate the four effects at each of the RF power settings. d) Compute the CI for the true effect when the RF power setting is set to its 3rd level. Compute the CI for the true effect when the RF power setting is set to its 4 th level. Interpret both CIs. e) What does the 1st CI in part d suggest regarding a hypothesis/claim that 3 rd effect is zero? What does the 2 nd CI in part d suggest regarding a hypothesis/claim that 4 th effect is zero? f) Compute the CI for the population variance of the errors, AND interpret it. SSTrectul=nia(yi.y.1)2=5[(551.2617.75)2+]=66871SSE=(n1)iaSi2=(51)(400.7+)=5339Fobs=MSEMSTr=5339(204)66871/41)=66.8Fobs>F,a1,94aRejectH0(1=2=)infavir Rejection Region. of H1 (at least 2 s ave differant. pvalue=pv(F>Fsbj)=pf(66.8,3,16,lower.tail=F)=2.9109 To illustrate the analysis of variance, return to the first example discussed in Section 3.1. Recall that the engineer is interested in determining if the RF power setting affects the etch rate, and she has run a completely randomized experiment with four levels of RF power and five replicates. For convenience, we repeat here the data from Table 3.1: We will use the analysis of variance to test H0:1= 2=3=4 against the alternative H1 : some means are different. The sums of squares required are computed using Equations 3.8, 3.9, and 3.10 as follows: SSTSSTrealments=i=14j=15yij2Ny:2=(575)2+(542)2++(710)220(12,355)2=72,209.75=n1i=14yi.2Ny..2=51[(2756)2++(3535)2]20(12,355)2=66,870.55 SSE=SSTSSTreatments=72,209.7566,870.55=5339.20 Usually, these calculations would be performed on a computer, using a software package with the capability to analyze data from designed experiments. The ANOVA is summarized in Table 3.4. Note that the RF power or between-treatment mean square (22,290.18) is many times larger than the within-treatment or error mean square (333.70). This indicates that it is unlikely that the treatment means are equal. More formally, we 6 Chapter 3 Experiments with a Single Factor: The Analysis of Variance TABLE 3.4 ANOVA for the Plasma Etching Experiment can compute the F ratio F0=22,290.18/333.70=66.80 and compare this to an appropriate upper-tail percentage point of the F3,16 distribution. To use a fixed significance level approach, suppose that the experimenter has selected =0.05. From Appendix Table IV we find that F0.05,3,16=3.24. Because F0=66.80>3.24, we reject H0 and conclude that the treatment means differ; that is, the RF power setting significantly affects the mean etch rate. We could also compute a P-value for this test statistic. Figure 3.3 shows the reference distribution (F3,16) for the test statistic F0. Clearly, the P-value is very small in this case. From Appendix Table A-4, we find that F0.013,16 =5.29 and because F0>5.29, we can conclude that an upper bound for the P-value is 0.01 ; that is, P
 Step by Step Solution
There are 3 Steps involved in it
Step: 1

Get Instant Access to Expert-Tailored Solutions
See step-by-step solutions with expert insights and AI powered tools for academic success
Step: 2

Step: 3
Ace Your Homework with AI
Get the answers you need in no time with our AI-driven, step-by-step assistance
Get Started
Database And Expert Systems Applications 31st International Conference Dexa 2020 Bratislava Slovakia September 14 17 2020 Proceedings Part 1 Lncs 12391
Authors: Sven Hartmann ,Josef Kung ,Gabriele Kotsis ,A Min Tjoa ,Ismail Khalil
1st Edition
303059002X, 978-3030590024