

Answered step by step
Verified Expert Solution
Question
1 Approved Answer
Pls write the answer in the paper sheet (not excel) Assignment # 5 Table 3-6 gives data on X (net profits after tax in U.S.
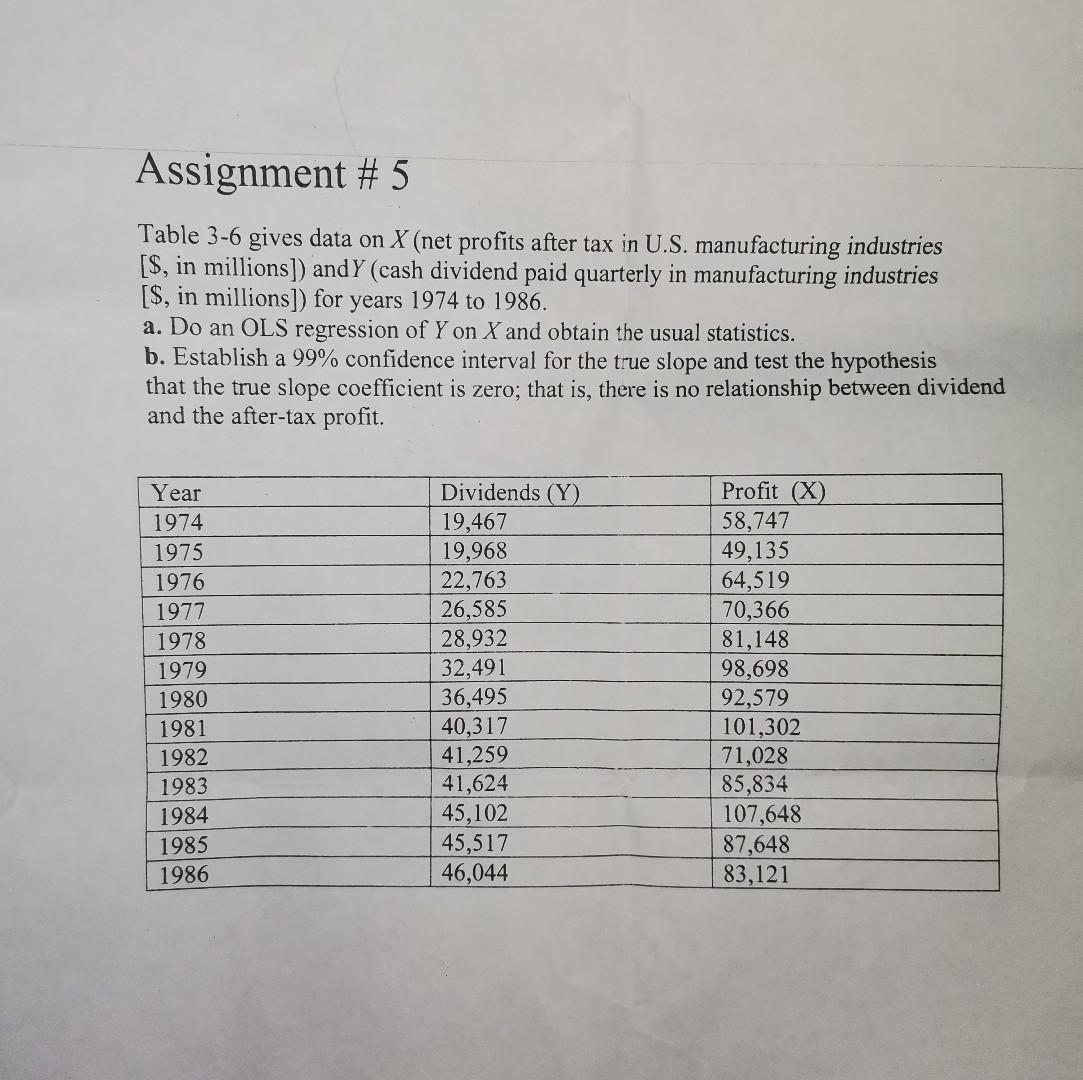
Pls write the answer in the paper sheet (not excel)
Assignment # 5 Table 3-6 gives data on X (net profits after tax in U.S. manufacturing industries [$, in millions]) andY (cash dividend paid quarterly in manufacturing industries [$, in millions]) for years 1974 to 1986. a. Do an OLS regression of Yon X and obtain the usual statistics. b. Establish a 99% confidence interval for the true slope and test the hypothesis that the true slope coefficient is zero; that is, there is no relationship between dividend and the after-tax profit. Year 1974 1975 1976 1977 1978 1979 1980 1981 1982 1983 1984 1985 1984 Dividends (Y) 19,467 19,968 22,763 26,585 28,932 32,491 36,495 40,317 41,259 41,624 45,102 45,517 46,044 Profit (X) 58,747 49,135 64,519 70,366 81,148 98,698 92,579 101,302 71,028 85,834 107,648 87,648 83,121 TTTTTTStep by Step Solution
There are 3 Steps involved in it
Step: 1

Get Instant Access to Expert-Tailored Solutions
See step-by-step solutions with expert insights and AI powered tools for academic success
Step: 2

Step: 3
Ace Your Homework with AI
Get the answers you need in no time with our AI-driven, step-by-step assistance
Get Started
The Theory Of Interest
Authors: Friedrich A. Lutz
2nd Edition
1138539074,1351472836