 plz be specific and well written answer thank you
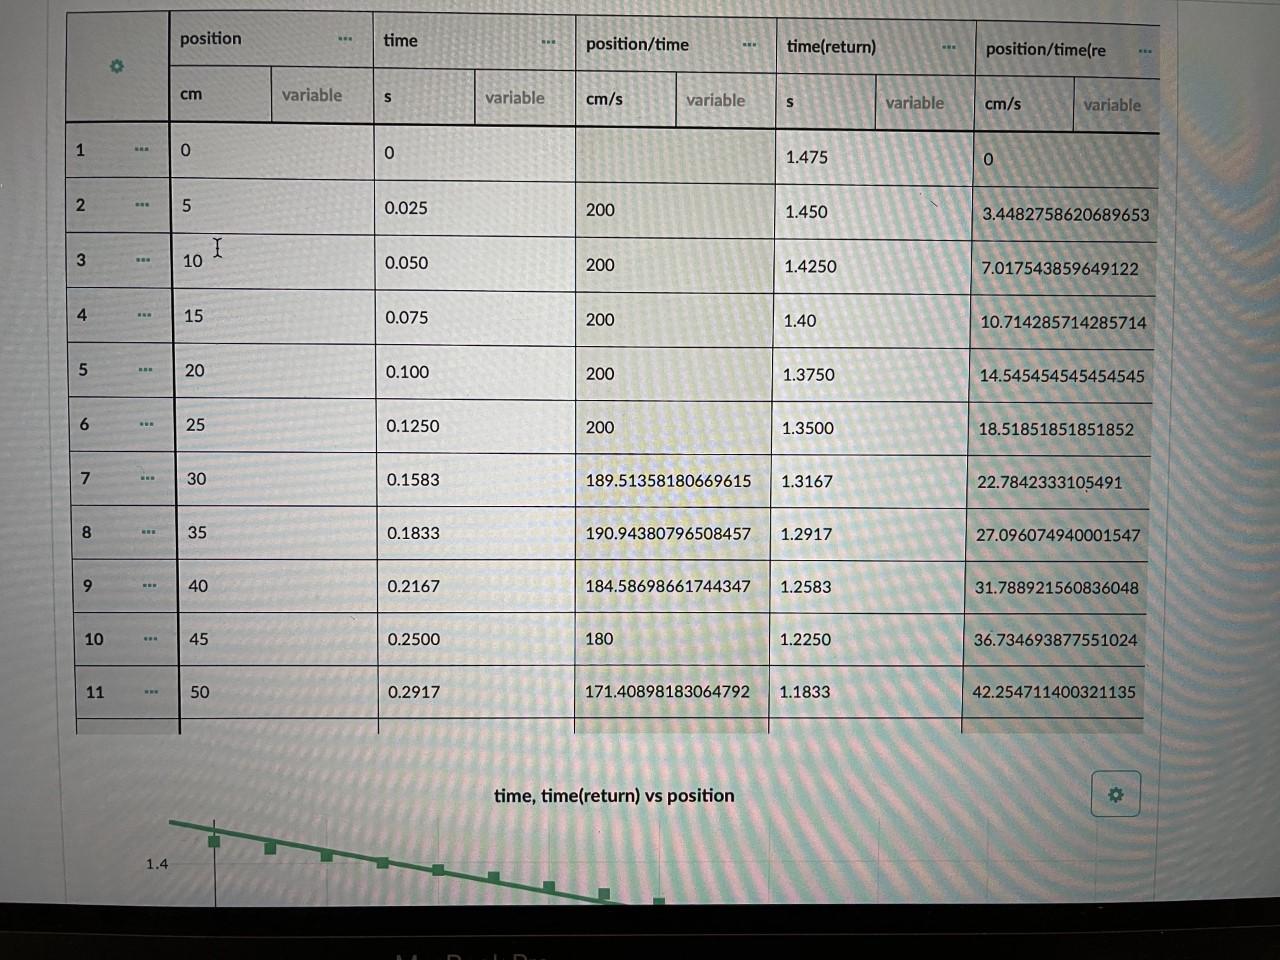
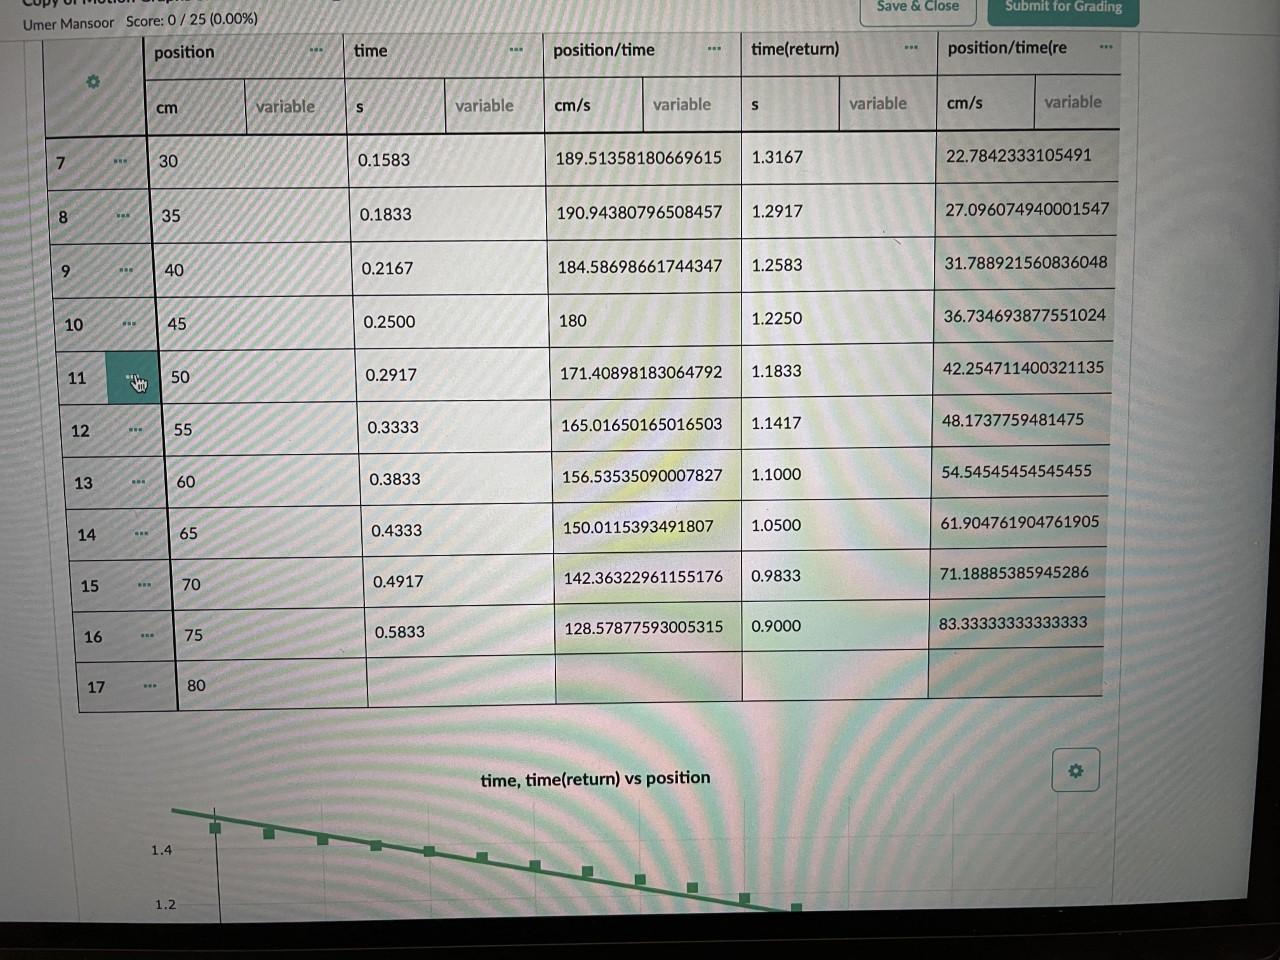
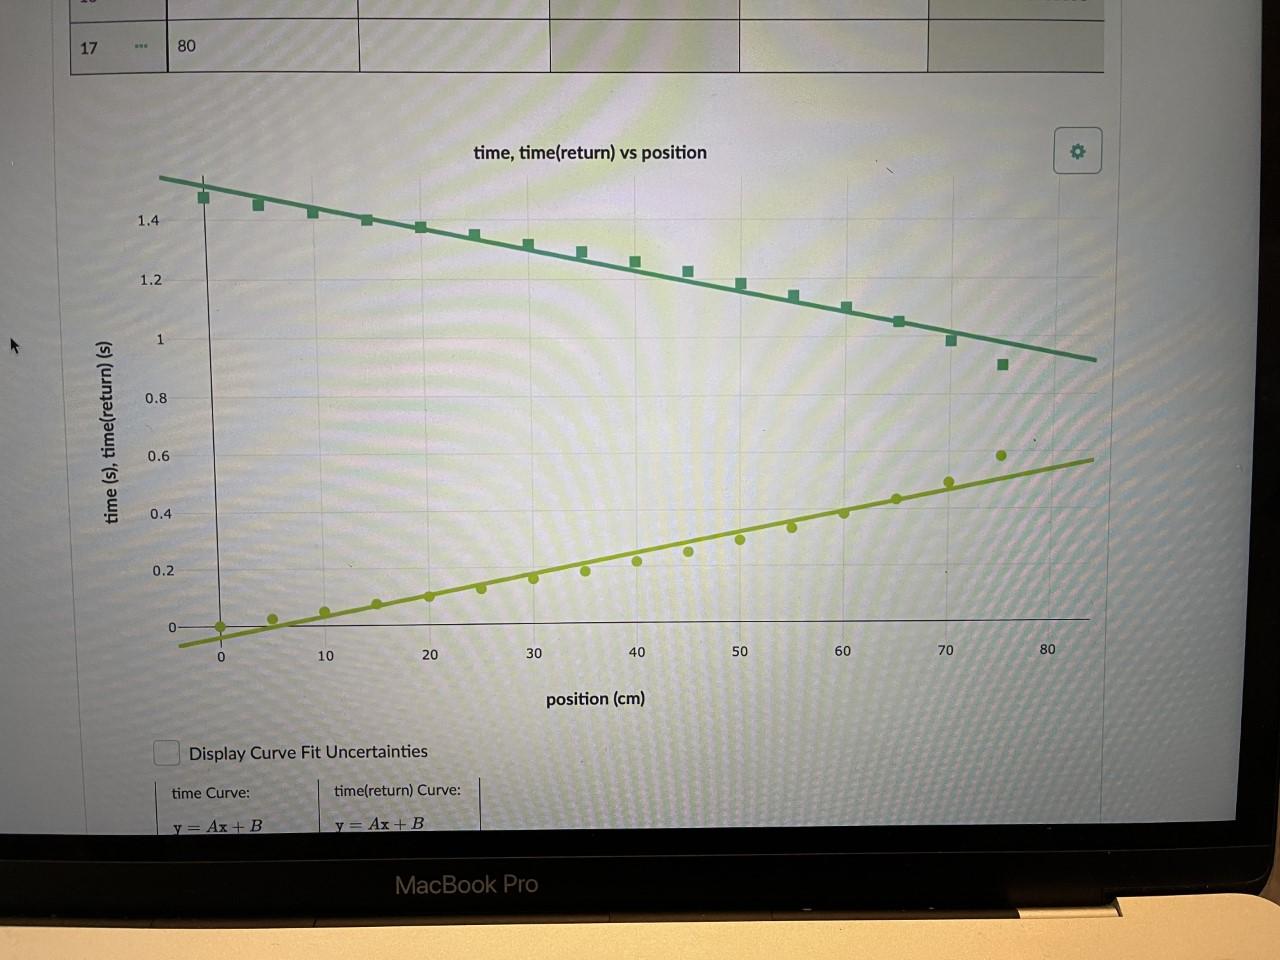
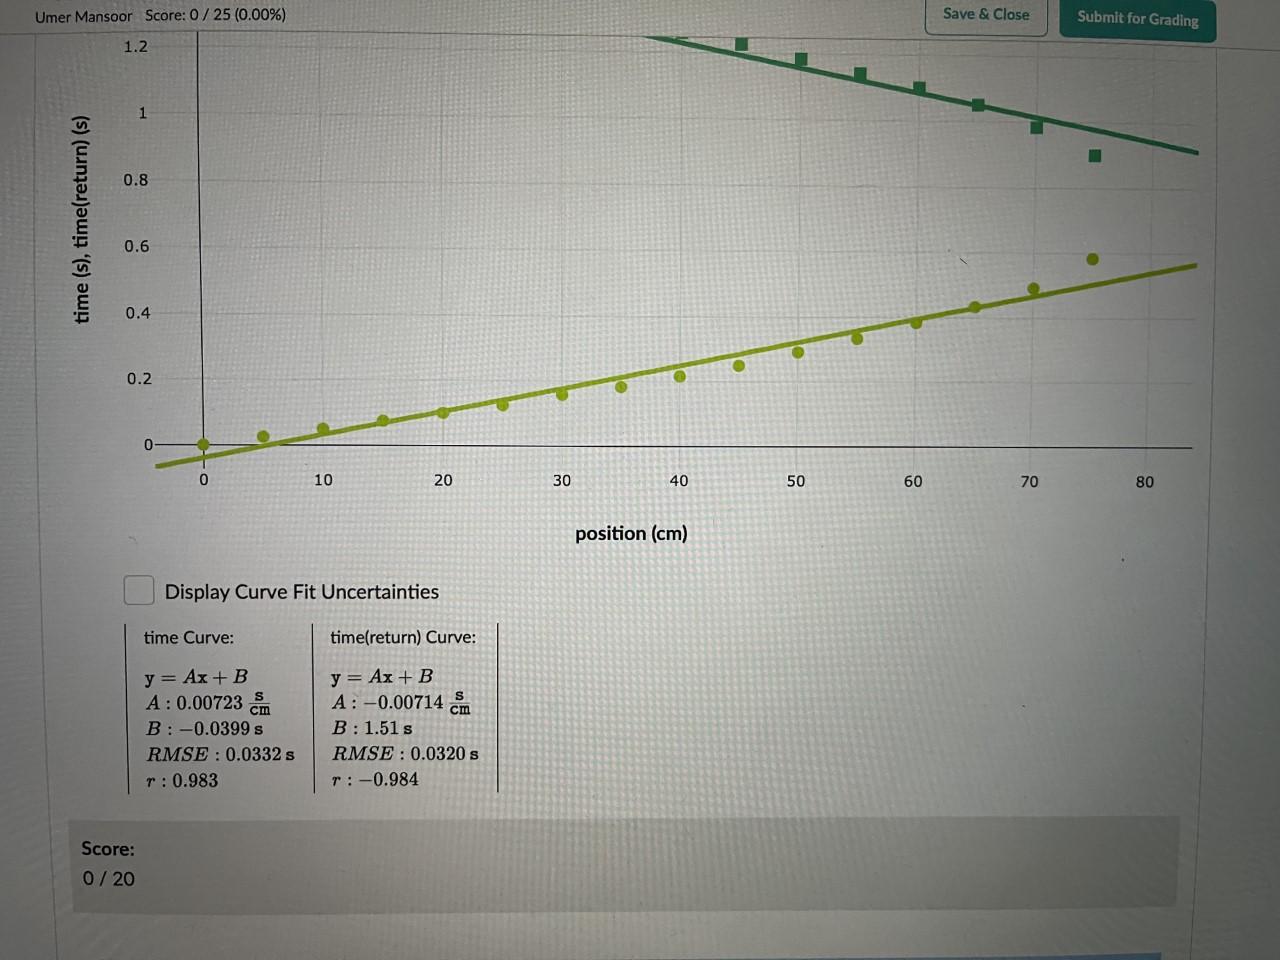
position time position/time time(return) position/time(re cm variable S variable cm/s variable s variable cm/s variable 1 .. 0 0 1.475 0 2 5 0.025 200 1.450 3.4482758620689653 3 10 0.050 200 1.4250 7.017543859649122 4 15 0.075 200 1.40 10.714285714285714 5 20 0.100 200 1.3750 14.545454545454545 6 ... 25 0.1250 200 1.3500 18.51851851851852 7 ... 30 0.1583 189.51358180669615 1.3167 22.7842333105491 8 8 -- 35 0.1833 190.94380796508457 1.2917 27.096074940001547 9 40 0.2167 184.58698661744347 1.2583 31.788921560836048 10 45 0.2500 180 1.2250 36.734693877551024 11 50 0.2917 171.40898183064792 1.1833 42.254711400321135 time, time(return) vs position 1.4 Save & Close Submit for Grading Umer Mansoor Score: 0/25 (0.00%) position time position/time time(return) position/time(re variable variable cm cm/s S variable variable S cm/s variable 7 30 0.1583 189.51358180669615 1.3167 22.7842333105491 8 35 0.1833 190.94380796508457 27.096074940001547 1.2917 40 9 0.2167 184.58698661744347 1.2583 31.788921560836048 10 45 0.2500 180 36.734693877551024 1.2250 11 42.254711400321135 171.40898183064792 1.1833 0.2917 50 Photo 12 1.1417 48.1737759481475 55 0.3333 165.01650165016503 156.53535090007827 1.1000 54.54545454545455 13 0.3833 60 150.0115393491807 61.904761904761905 ... 1.0500 14 0.4333 65 142.36322961155176 0.9833 71.18885385945286 15 0.4917 70 0.9000 128.57877593005315 83.33333333333333 16 ... 75 0.5833 17 BE 80 time, time(return) vs position 1.4 1.2 17 80 time, time(return) vs position 1.4 1.2 1 0.8 time (s), time(return) (s) 0.6 0.4 0.2 0 20 30 40 10 50 60 0 70 80 position (cm) Display Curve Fit Uncertainties time Curve: time(return) Curve: y = Ax +B y = Ax+B MacBook Pro Umer Mansoor Score: 0/25 (0.00%) Save & Close Submit for Grading 1.2 1 0.8 time (s), time(return) (s) 0.6 0.4 0 0.2 0 0 10 20 30 40 50 60 70 80 position (cm) Display Curve Fit Uncertainties time Curve: time(return) Curve: cm y = Ax+B A: 0.00723 B: -0.0399 s RMSE: 0.0332 s T: 0.983 y = Ax+ B A:-0.00714 cm B: 1.51 s RMSE: 0.0320 s T: -0.984 Score: 0/20 0.984 Score: 0 / 20 2. Using your observations from the graphs you made, and from watching the video, describe the velocity and acceleration of the glider at the moment it reaches the maximum distance from where is was released. BIU = = = Score: 0/5 MacBook Pro Q wi # $ % & 3 4 II + 5 6 7 8 position time position/time time(return) position/time(re cm variable S variable cm/s variable s variable cm/s variable 1 .. 0 0 1.475 0 2 5 0.025 200 1.450 3.4482758620689653 3 10 0.050 200 1.4250 7.017543859649122 4 15 0.075 200 1.40 10.714285714285714 5 20 0.100 200 1.3750 14.545454545454545 6 ... 25 0.1250 200 1.3500 18.51851851851852 7 ... 30 0.1583 189.51358180669615 1.3167 22.7842333105491 8 8 -- 35 0.1833 190.94380796508457 1.2917 27.096074940001547 9 40 0.2167 184.58698661744347 1.2583 31.788921560836048 10 45 0.2500 180 1.2250 36.734693877551024 11 50 0.2917 171.40898183064792 1.1833 42.254711400321135 time, time(return) vs position 1.4 Save & Close Submit for Grading Umer Mansoor Score: 0/25 (0.00%) position time position/time time(return) position/time(re variable variable cm cm/s S variable variable S cm/s variable 7 30 0.1583 189.51358180669615 1.3167 22.7842333105491 8 35 0.1833 190.94380796508457 27.096074940001547 1.2917 40 9 0.2167 184.58698661744347 1.2583 31.788921560836048 10 45 0.2500 180 36.734693877551024 1.2250 11 42.254711400321135 171.40898183064792 1.1833 0.2917 50 Photo 12 1.1417 48.1737759481475 55 0.3333 165.01650165016503 156.53535090007827 1.1000 54.54545454545455 13 0.3833 60 150.0115393491807 61.904761904761905 ... 1.0500 14 0.4333 65 142.36322961155176 0.9833 71.18885385945286 15 0.4917 70 0.9000 128.57877593005315 83.33333333333333 16 ... 75 0.5833 17 BE 80 time, time(return) vs position 1.4 1.2 17 80 time, time(return) vs position 1.4 1.2 1 0.8 time (s), time(return) (s) 0.6 0.4 0.2 0 20 30 40 10 50 60 0 70 80 position (cm) Display Curve Fit Uncertainties time Curve: time(return) Curve: y = Ax +B y = Ax+B MacBook Pro Umer Mansoor Score: 0/25 (0.00%) Save & Close Submit for Grading 1.2 1 0.8 time (s), time(return) (s) 0.6 0.4 0 0.2 0 0 10 20 30 40 50 60 70 80 position (cm) Display Curve Fit Uncertainties time Curve: time(return) Curve: cm y = Ax+B A: 0.00723 B: -0.0399 s RMSE: 0.0332 s T: 0.983 y = Ax+ B A:-0.00714 cm B: 1.51 s RMSE: 0.0320 s T: -0.984 Score: 0/20 0.984 Score: 0 / 20 2. Using your observations from the graphs you made, and from watching the video, describe the velocity and acceleration of the glider at the moment it reaches the maximum distance from where is was released. BIU = = = Score: 0/5 MacBook Pro Q wi # $ % & 3 4 II + 5 6 7 8


 plz be specific and well written answer thank you


