Answered step by step
Verified Expert Solution
Link Copied!

Question

1 Approved Answer

plz help on this project Telegraf is an agent written in Go for collecting, processing, aggregating, and writing metrics. Design goals are to have a

plz help on this projectimage text in transcribed
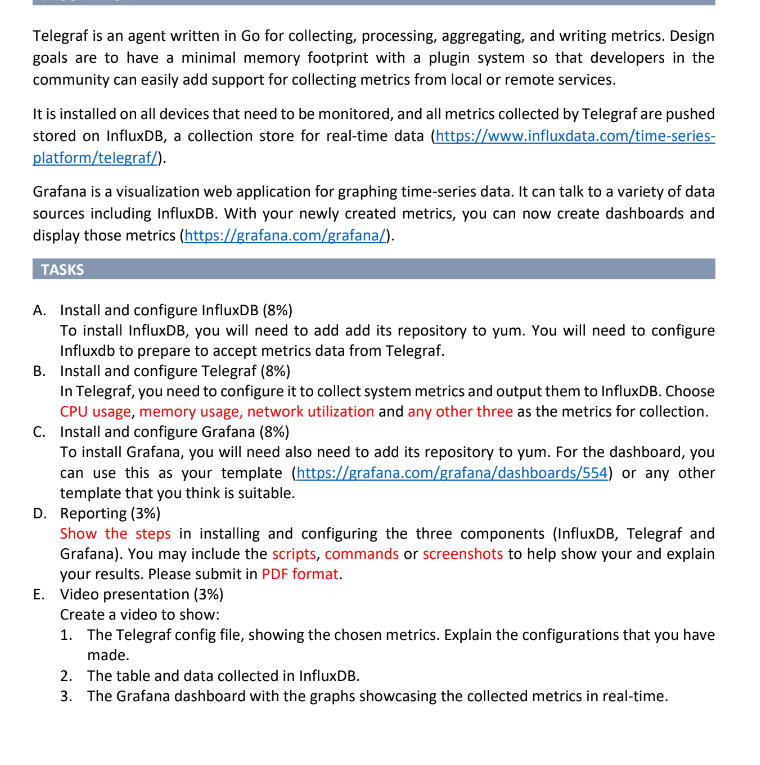
Telegraf is an agent written in Go for collecting, processing, aggregating, and writing metrics. Design goals are to have a minimal memory footprint with a plugin system so that developers in the community can easily add support for collecting metrics from local or remote services. It is installed on all devices that need to be monitored, and all metrics collected by Telegraf are pushed stored on InfluxDB, a collection store for real-time data (https://www.influxdata.com/time-seriesplatform/telegraf/). Grafana is a visualization web application for graphing time-series data. It can talk to a variety of data sources including InfluxDB. With your newly created metrics, you can now create dashboards and display those metrics (https://grafana.com/grafana/). TASKS A. Install and configure InfluxDB (8\%) To install InfluxDB, you will need to add add its repository to yum. You will need to configure Influxdb to prepare to accept metrics data from Telegraf. B. Install and configure Telegraf (8\%) In Telegraf, you need to configure it to collect system metrics and output them to InfluxDB. Choose CPU usage, memory usage, network utilization and any other three as the metrics for collection. C. Install and configure Grafana (8\%) To install Grafana, you will need also need to add its repository to yum. For the dashboard, you can use this as your template (https://grafana.com/grafana/dashboards/554) or any other template that you think is suitable. D. Reporting (3\%) Show the steps in installing and configuring the three components (InfluxDB, Telegraf and Grafana). You may include the scripts, commands or screenshots to help show your and explain your results. Please submit in PDF format. E. Video presentation (3\%) Create a video to show: 1. The Telegraf config file, showing the chosen metrics. Explain the configurations that you have made. 2. The table and data collected in InfluxDB. 3. The Grafana dashboard with the graphs showcasing the collected metrics in real-time

Step by Step Solution

There are 3 Steps involved in it

Step: 1

blur-text-image

Get Instant Access to Expert-Tailored Solutions

See step-by-step solutions with expert insights and AI powered tools for academic success

Step: 2

blur-text-image

Step: 3

blur-text-image

Ace Your Homework with AI

Get the answers you need in no time with our AI-driven, step-by-step assistance

Get Started

Recommended Textbook for

Machine Learning And Knowledge Discovery In Databases European Conference Ecml Pkdd 2015 Porto Portugal September 7 11 2015 Proceedings Part 1 Lnai 9284

Authors: Annalisa Appice ,Pedro Pereira Rodrigues ,Vitor Santos Costa ,Carlos Soares ,Joao Gama ,Alipio Jorge

1st Edition

3319235273, 978-3319235271

More Books

Students also viewed these Databases questions

Question

a. Compute = E(Y). Pg45

Answered: 1 week ago

Question

1. Define mass and mediated communication

Answered: 1 week ago