

Answered step by step
Verified Expert Solution
Question
1 Approved Answer
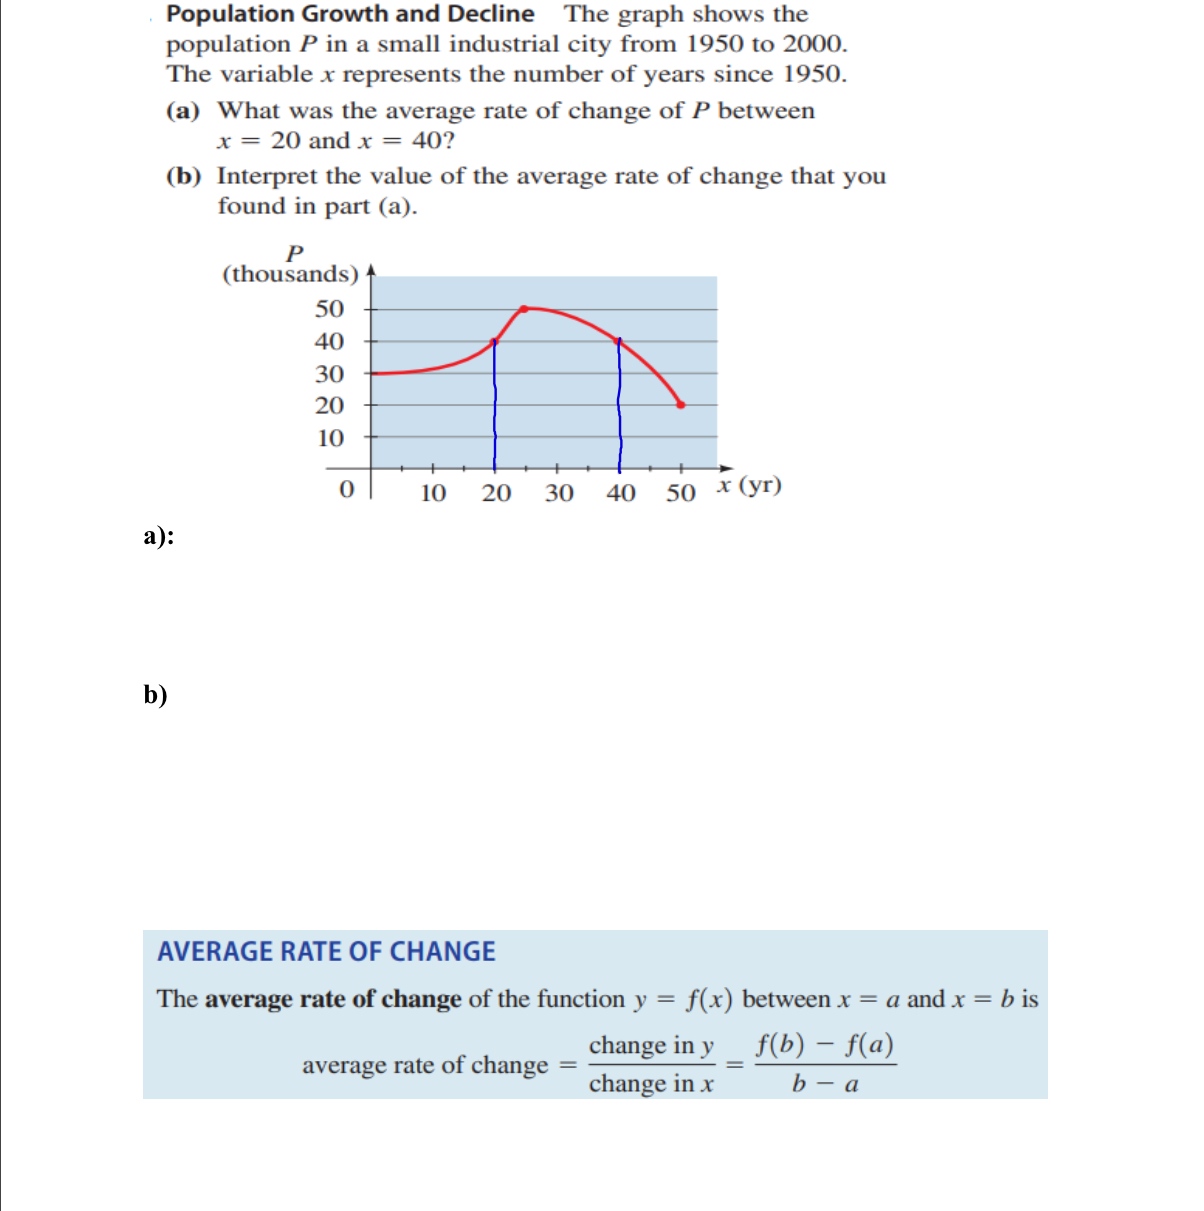
Population Growth and Decline The graph shows the population P in a small industrial city from 1950 to 2000. The variable x represents the number

Step by Step Solution
There are 3 Steps involved in it
Step: 1

Get Instant Access to Expert-Tailored Solutions
See step-by-step solutions with expert insights and AI powered tools for academic success
Step: 2

Step: 3
Ace Your Homework with AI
Get the answers you need in no time with our AI-driven, step-by-step assistance
Get Started
Intermediate Algebra (Subscription)
Authors: Elayn Martin Gay
7th Edition
0134305116, 9780134305110