

Answered step by step
Verified Expert Solution
Question
1 Approved Answer
Portfolio analysis You have beri given the expecled retum data shown in the first table on three assets - F, G, and H- over the
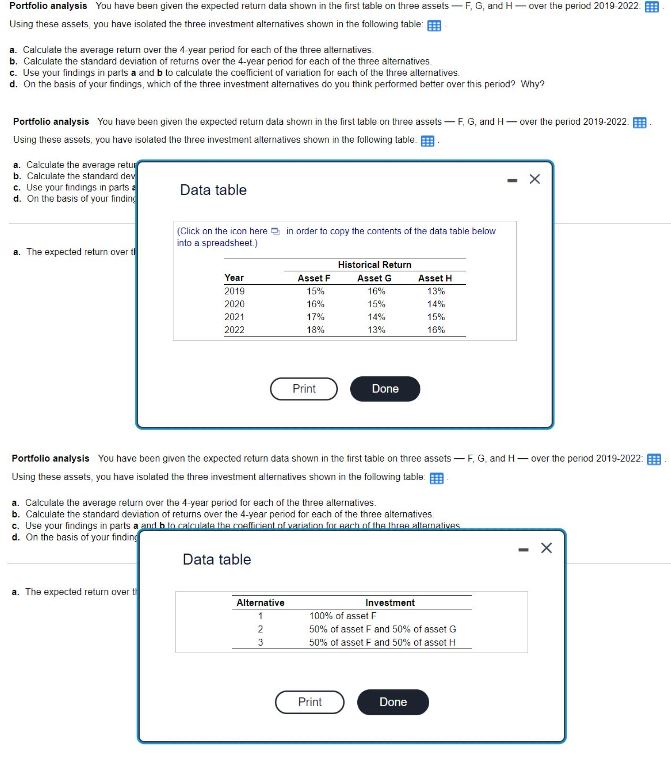 Portfolio analysis You have beri given the expecled retum data shown in the first table on three assets - F, G, and H- over the period 20192022 . Eit . Using these assets you have isolated the three investment alternatives shown in the following table: a. Calculate the average return over the 4 year period for each of the three alternatives. b. Calculate the standard deviation of returns over the 4-year period for each of the three alternatives c. Use your fird ngs in parts a and b to calculate the coeficient of variation for each of the three allematives. d. On the basis of your findings, which of the three investment alternatives do you think performed better over this period? Why? Portfolio analysis You have been given the expected return datla shown in the Cirst lable on turee assets - F, G, and H- cver the period 2019 -2022. Using these assets, you have isolated the three investment altematives shown in the following lable. a. Cakulate the average retur b. Calculate the standard dev c. Use your tindings in parts \& d. On the basis of your finding Data table a. The expected return over tl (Click on the icon here p in order to copy the contents of the data table below into a spreadsheet.) Portfolio analysis You have been gven the expected return data shown in the first table on three assets - F, G, and H over the period 20192022 : EB . Using these assets, you have isolated the three irvestment alternatives shown in the following table: a. Calculate the average relum over the 4 -year period for each of the thee allematives. b. Calculate the standard deviation of returns over the 4-year period for each of the three altematives c. Use your findings in parts a and h to calculate the cmefficient rifvatiation for eachufithe lores allematives d. On the basis of your finding Data table a. The expected return over t
 Step by Step Solution
There are 3 Steps involved in it
Step: 1

Get Instant Access to Expert-Tailored Solutions
See step-by-step solutions with expert insights and AI powered tools for academic success
Step: 2

Step: 3
Ace Your Homework with AI
Get the answers you need in no time with our AI-driven, step-by-step assistance
Get Started
Social Media Audits Achieving Deep Impact Without Sacrificing The Bottom Line
Authors: Urs E Gattiker
1st Edition
1843347458, 978-1843347453