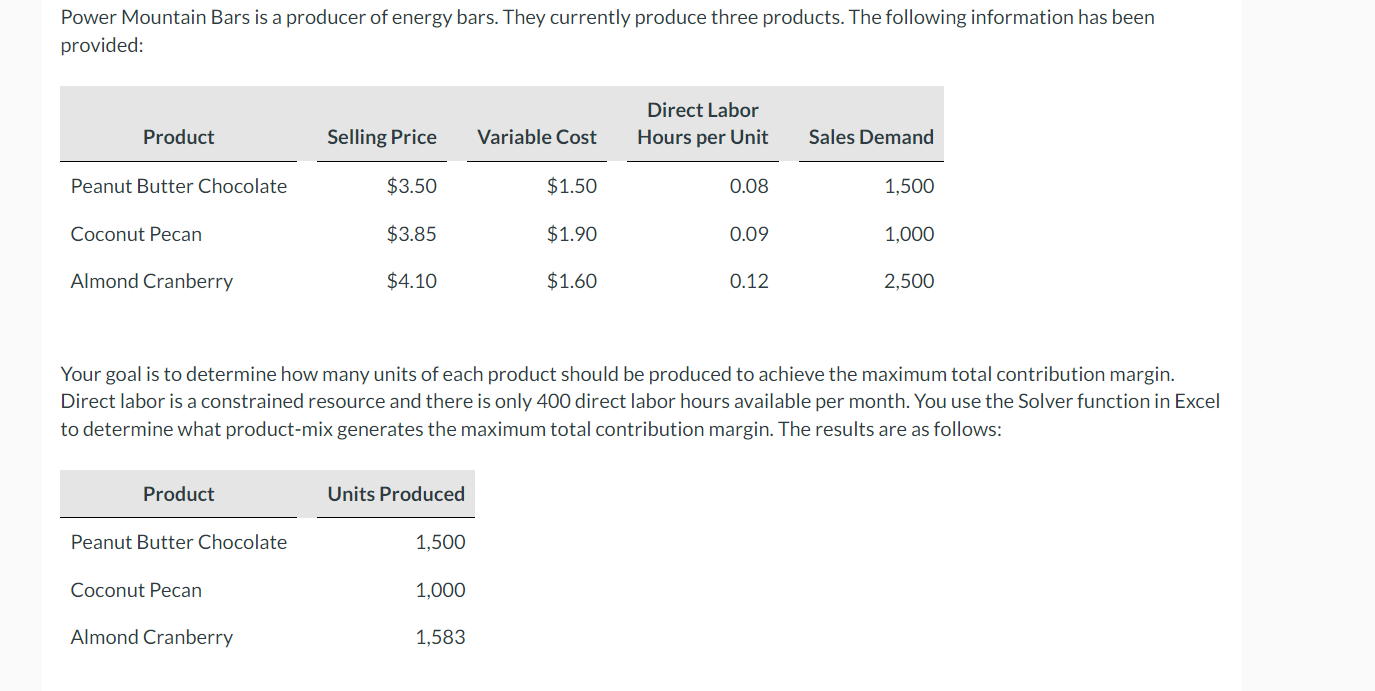
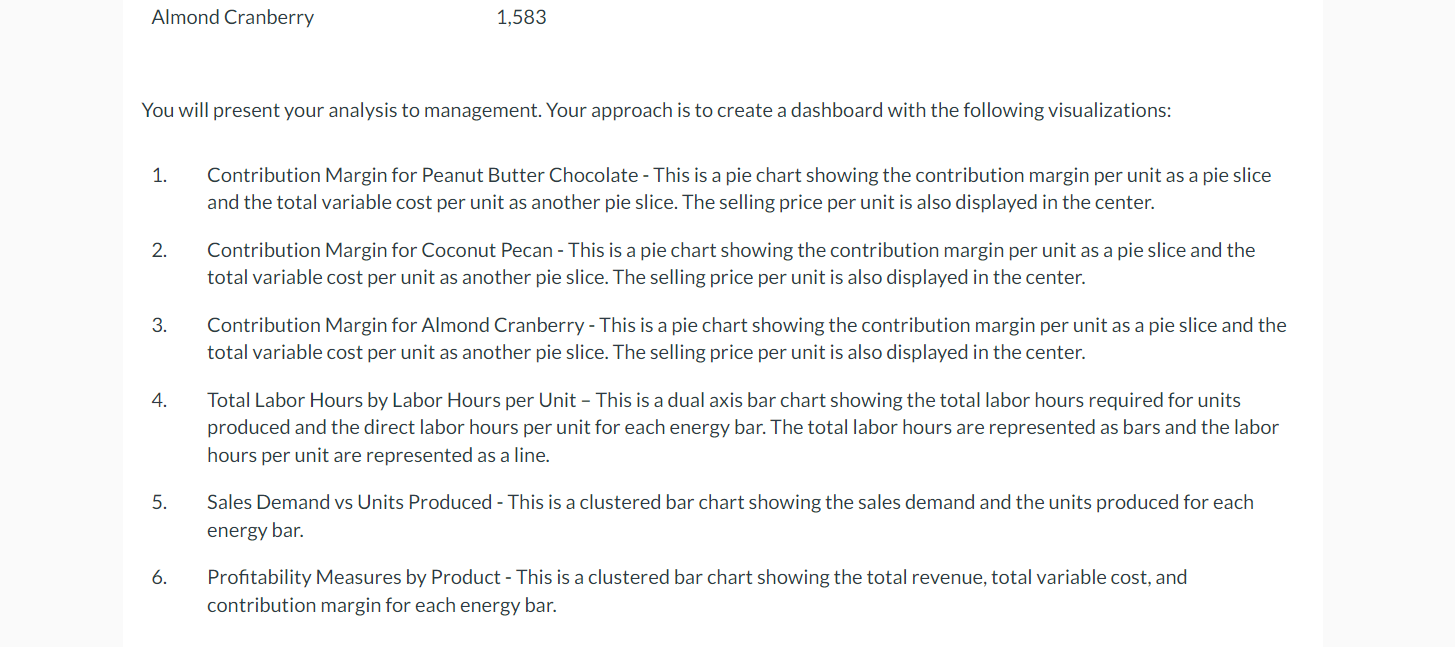
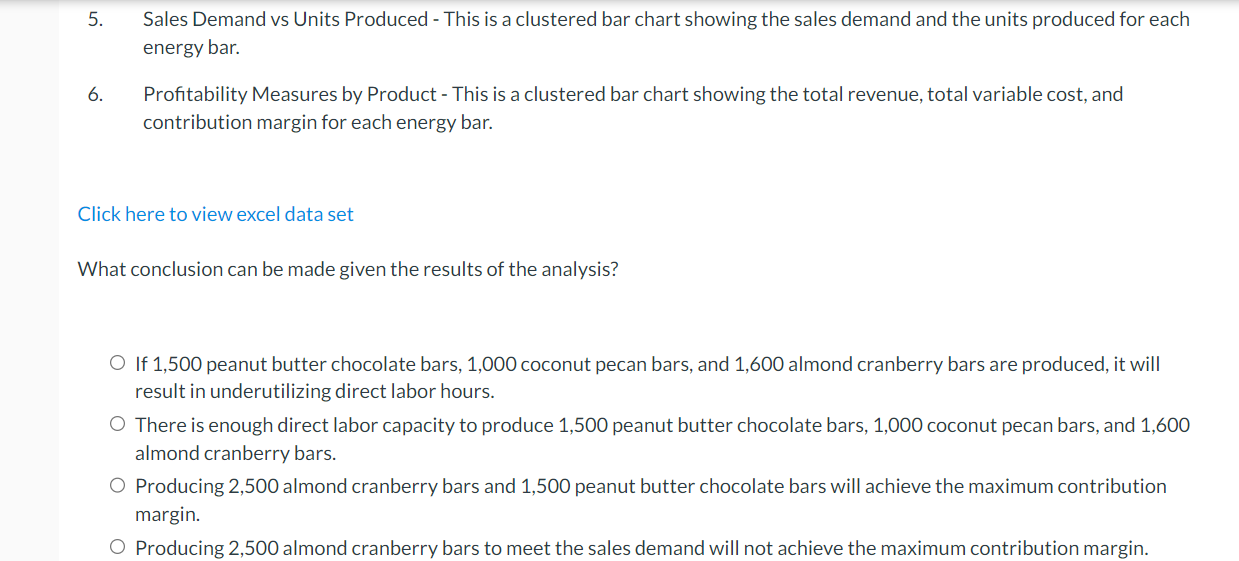
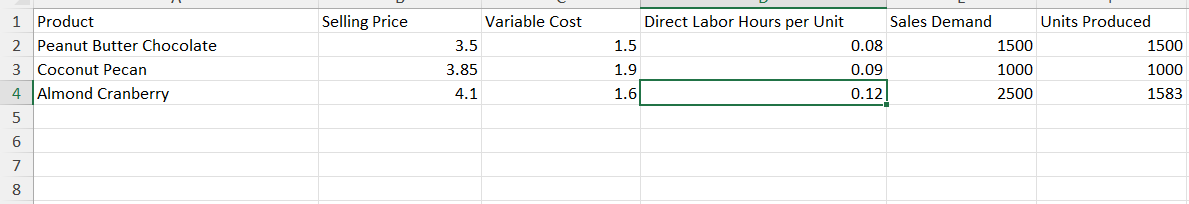
Power Mountain Bars is a producer of energy bars. They currently produce three products. The following information has been provided: Your goal is to determine how many units of each product should be produced to achieve the maximum total contribution margin. Direct labor is a constrained resource and there is only 400 direct labor hours available per month. You use the Solver function in Excel to determine what product-mix generates the maximum total contribution margin. The results are as follows: You will present your analysis to management. Your approach is to create a dashboard with the following visualizations: 1. Contribution Margin for Peanut Butter Chocolate - This is a pie chart showing the contribution margin per unit as a pie slice and the total variable cost per unit as another pie slice. The selling price per unit is also displayed in the center. 2. Contribution Margin for Coconut Pecan - This is a pie chart showing the contribution margin per unit as a pie slice and the total variable cost per unit as another pie slice. The selling price per unit is also displayed in the center. 3. Contribution Margin for Almond Cranberry - This is a pie chart showing the contribution margin per unit as a pie slice and the total variable cost per unit as another pie slice. The selling price per unit is also displayed in the center. 4. Total Labor Hours by Labor Hours per Unit - This is a dual axis bar chart showing the total labor hours required for units produced and the direct labor hours per unit for each energy bar. The total labor hours are represented as bars and the labor hours per unit are represented as a line. 5. Sales Demand vs Units Produced - This is a clustered bar chart showing the sales demand and the units produced for each energy bar. 6. Profitability Measures by Product - This is a clustered bar chart showing the total revenue, total variable cost, and contribution margin for each energy bar. 5. Sales Demand vs Units Produced - This is a clustered bar chart showing the sales demand and the units produced for each energy bar. 6. Profitability Measures by Product - This is a clustered bar chart showing the total revenue, total variable cost, and contribution margin for each energy bar. Click here to view excel data set What conclusion can be made given the results of the analysis? If 1,500 peanut butter chocolate bars, 1,000 coconut pecan bars, and 1,600 almond cranberry bars are produced, it will result in underutilizing direct labor hours. There is enough direct labor capacity to produce 1,500 peanut butter chocolate bars, 1,000 coconut pecan bars, and 1,600 almond cranberry bars. Producing 2,500 almond cranberry bars and 1,500 peanut butter chocolate bars will achieve the maximum contribution margin. Producing 2,500 almond cranberry bars to meet the sales demand will not achieve the maximum contribution margin. Power Mountain Bars is a producer of energy bars. They currently produce three products. The following information has been provided: Your goal is to determine how many units of each product should be produced to achieve the maximum total contribution margin. Direct labor is a constrained resource and there is only 400 direct labor hours available per month. You use the Solver function in Excel to determine what product-mix generates the maximum total contribution margin. The results are as follows: You will present your analysis to management. Your approach is to create a dashboard with the following visualizations: 1. Contribution Margin for Peanut Butter Chocolate - This is a pie chart showing the contribution margin per unit as a pie slice and the total variable cost per unit as another pie slice. The selling price per unit is also displayed in the center. 2. Contribution Margin for Coconut Pecan - This is a pie chart showing the contribution margin per unit as a pie slice and the total variable cost per unit as another pie slice. The selling price per unit is also displayed in the center. 3. Contribution Margin for Almond Cranberry - This is a pie chart showing the contribution margin per unit as a pie slice and the total variable cost per unit as another pie slice. The selling price per unit is also displayed in the center. 4. Total Labor Hours by Labor Hours per Unit - This is a dual axis bar chart showing the total labor hours required for units produced and the direct labor hours per unit for each energy bar. The total labor hours are represented as bars and the labor hours per unit are represented as a line. 5. Sales Demand vs Units Produced - This is a clustered bar chart showing the sales demand and the units produced for each energy bar. 6. Profitability Measures by Product - This is a clustered bar chart showing the total revenue, total variable cost, and contribution margin for each energy bar. 5. Sales Demand vs Units Produced - This is a clustered bar chart showing the sales demand and the units produced for each energy bar. 6. Profitability Measures by Product - This is a clustered bar chart showing the total revenue, total variable cost, and contribution margin for each energy bar. Click here to view excel data set What conclusion can be made given the results of the analysis? If 1,500 peanut butter chocolate bars, 1,000 coconut pecan bars, and 1,600 almond cranberry bars are produced, it will result in underutilizing direct labor hours. There is enough direct labor capacity to produce 1,500 peanut butter chocolate bars, 1,000 coconut pecan bars, and 1,600 almond cranberry bars. Producing 2,500 almond cranberry bars and 1,500 peanut butter chocolate bars will achieve the maximum contribution margin. Producing 2,500 almond cranberry bars to meet the sales demand will not achieve the maximum contribution margin