Answered step by step
Verified Expert Solution
Link Copied!

Question

1 Approved Answer

PR 21-4A Break-even sales and cost-volume-profit chart OBJ, 3, 4 Last year, Hever Inc. had sales of $500,000, based on a unit selling price of
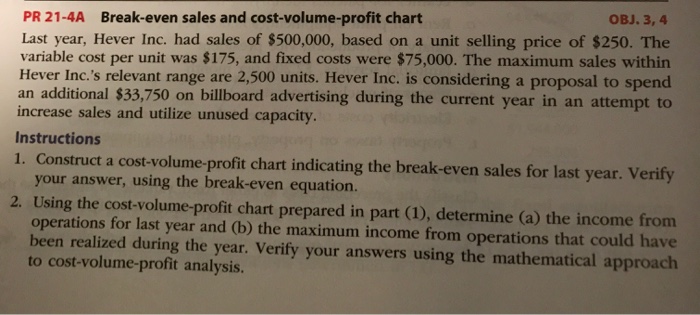
image text in transcribed
PR 21-4A Break-even sales and cost-volume-profit chart OBJ, 3, 4 Last year, Hever Inc. had sales of $500,000, based on a unit selling price of $250. The variable cost per unit was $175, and fixed costs were $75,000. The maximum sales within Hever Inc.'s relevant range are 2,500 units. Hever Inc. is considering a proposal to spend an additional $33,750 on billboard advertising during the current year in an attempt to increase and utilize capacity. Instructions 1. Construct a cost-volume-profit chart indicating for last year. verify your the break-even sales answer, using the break-even equation. 2. Using the cost-volume-profit chart prepared in part (1), determine (a) the income from operations for last year and (b) the maximum income from operations that could have been realized during the year. Verify your answers using the mathematical approach to cost-volume-profit analysis

Step by Step Solution

There are 3 Steps involved in it

Step: 1

blur-text-image

Get Instant Access to Expert-Tailored Solutions

See step-by-step solutions with expert insights and AI powered tools for academic success

Step: 2

blur-text-image_2

Step: 3

blur-text-image_3

Ace Your Homework with AI

Get the answers you need in no time with our AI-driven, step-by-step assistance

Get Started

Students also viewed these Accounting questions