

Answered step by step
Verified Expert Solution
Question
1 Approved Answer
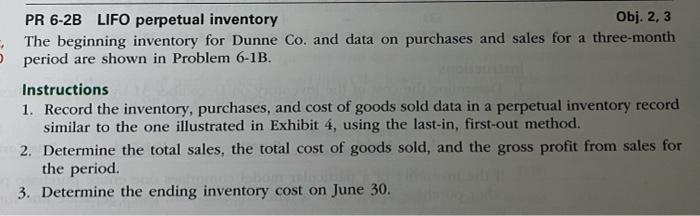
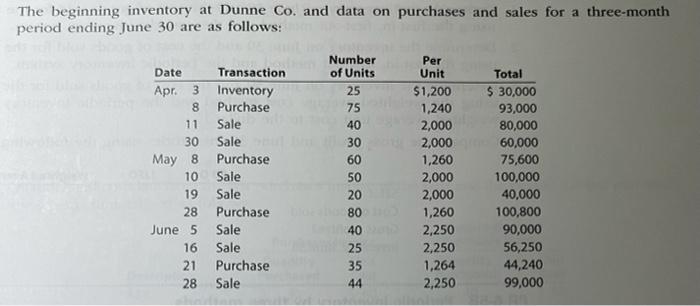
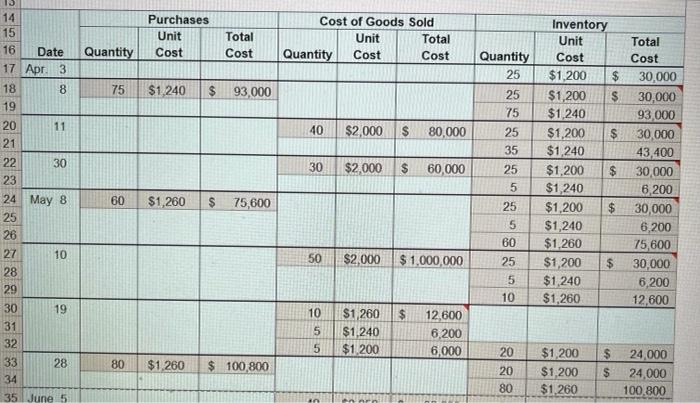
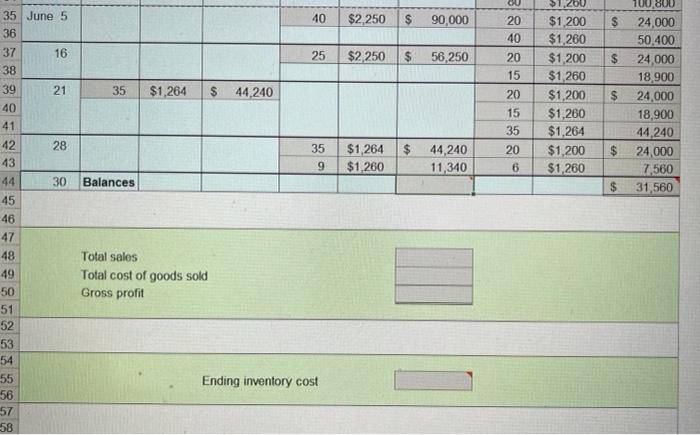
PR 6-2B LIFO perpetual inventory Obj. 2, 3 The beginning inventory for Dunne Co. and data on purchases and sales for a three-month period are
Step by Step Solution
There are 3 Steps involved in it
Step: 1

Get Instant Access to Expert-Tailored Solutions
See step-by-step solutions with expert insights and AI powered tools for academic success
Step: 2

Step: 3
Ace Your Homework with AI
Get the answers you need in no time with our AI-driven, step-by-step assistance
Get Started
Financial Accounting A Course For All Majors
Authors: David W. OBryan
1st Edition
1617350958, 978-1617350955