Answered step by step
Verified Expert Solution
Question
1 Approved Answer
Prepare a material variance analysis and a labor variance analysis. For each analysis, assume that your actual volume is 10% less than you anticipated. Define


Prepare a material variance analysis and a labor variance analysis. For each analysis, assume that your actual volume is 10% less than you anticipated.
Define your cost, revenue, profit, and investment centers.
Compute Residual Income.
Are you profitable? Are you solvent? Have you created value?
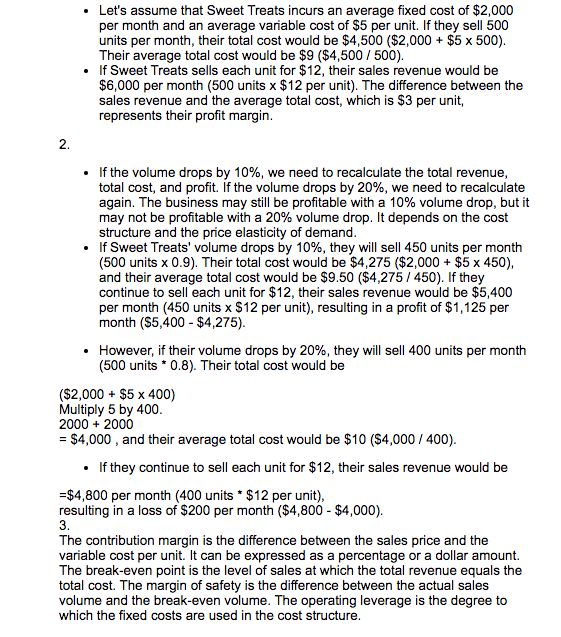
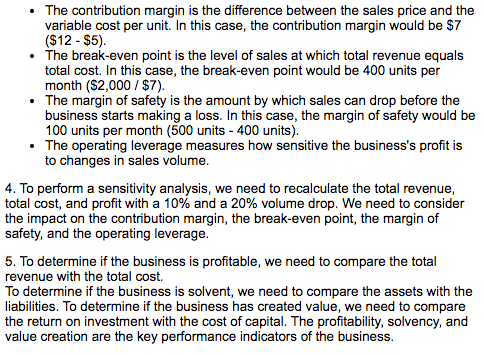
- Let's assume that Sweet Treats incurs an average fixed cost of $2,000 per month and an average variable cost of $5 per unit. If they sell 500 units per month, their total cost would be $4,500($2,000+$5500). Their average total cost would be $9($4,500/500). - If Sweet Treats sells each unit for $12, their sales revenue would be $6,000 per month (500 units $12 per unit). The difference between the sales revenue and the average total cost, which is $3 per unit, represents their profit margin. 2. - If the volume drops by 10%, we need to recalculate the total revenue, total cost, and profit. If the volume drops by 20%, we need to recalculate again. The business may still be profitable with a 10% volume drop, but it may not be profitable with a 20% volume drop. It depends on the cost structure and the price elasticity of demand. - If Sweet Treats' volume drops by 10%, they will sell 450 units per month (500 units 0.9). Their total cost would be $4,275($2,000+$5450), and their average total cost would be $9.50($4,275/450). If they continue to sell each unit for $12, their sales revenue would be $5,400 per month (450 units x$12 per unit), resulting in a profit of $1,125 per month ($5,400$4,275). - However, if their volume drops by 20%, they will sell 400 units per month (500 units 0.8). Their total cost would be ($2,000+$5400)Multiply5by400.2000+2000=$4,000,andtheiraveragetotalcostwouldbe$10($4,000/400). - If they continue to sell each unit for $12, their sales revenue would be =$4,800 per month (400 units $12 per unit), resulting in a loss of $200 per month ($4,800$4,000). 3. The contribution margin is the difference between the sales price and the variable cost per unit. It can be expressed as a percentage or a dollar amount. The break-even point is the level of sales at which the total revenue equals the total cost. The margin of safety is the difference between the actual sales volume and the break-even volume. The operating leverage is the degree to which the fixed costs are used in the cost structure. - The contribution margin is the difference between the sales price and the variable cost per unit. In this case, the contribution margin would be $7 (\$12 - \$5). - The break-even point is the level of sales at which total revenue equals total cost. In this case, the break-even point would be 400 units per month ($2,000/$7). - The margin of safety is the amount by which sales can drop before the business starts making a loss. In this case, the margin of safety would be 100 units per month ( 500 units - 400 units). - The operating leverage measures how sensitive the business's profit is to changes in sales volume. 4. To perform a sensitivity analysis, we need to recalculate the total revenue, total cost, and profit with a 10% and a 20% volume drop. We need to consider the impact on the contribution margin, the break-even point, the margin of safety, and the operating leverage. 5. To determine if the business is profitable, we need to compare the total revenue with the total cost. To determine if the business is solvent, we need to compare the assets with the liabilities. To determine if the business has created value, we need to compare the return on investment with the cost of capital. The profitability, solvency, and value creation are the key performance indicators of the businessStep by Step Solution
There are 3 Steps involved in it
Step: 1

Get Instant Access to Expert-Tailored Solutions
See step-by-step solutions with expert insights and AI powered tools for academic success
Step: 2

Step: 3

Ace Your Homework with AI
Get the answers you need in no time with our AI-driven, step-by-step assistance
Get Started


