Answered step by step
Verified Expert Solution
Link Copied!

Question

1 Approved Answer

Presented here are summarized data from the balance sheets and income statements of Wiper, Inc.: WIPER, INC. Condensed Balance Sheets December 31, 2017, 2016, 2015
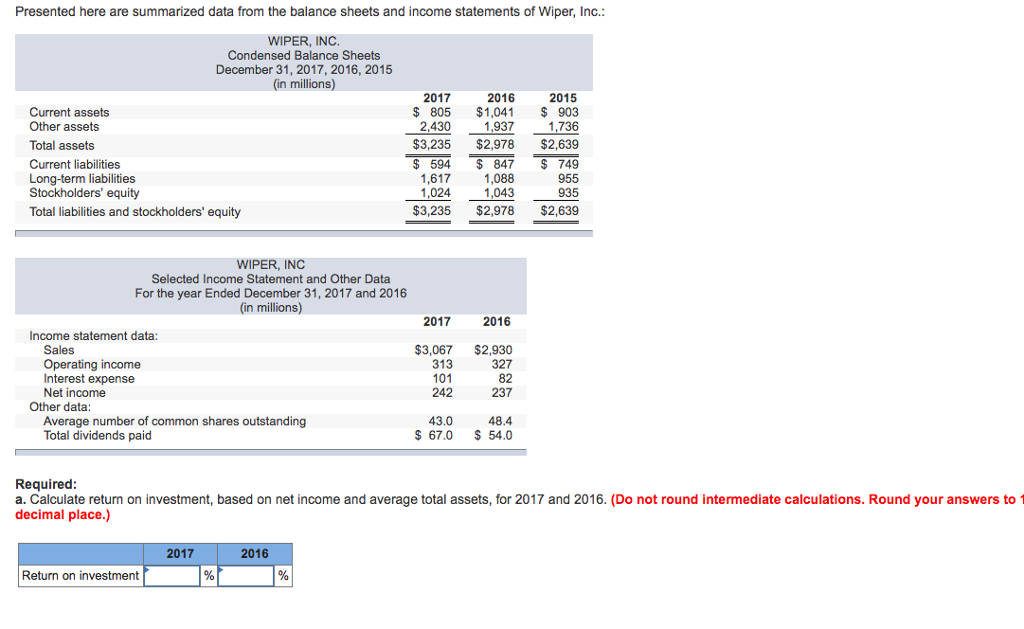
image text in transcribedimage text in transcribedimage text in transcribedimage text in transcribed

Presented here are summarized data from the balance sheets and income statements of Wiper, Inc.: WIPER, INC. Condensed Balance Sheets December 31, 2017, 2016, 2015 (in millions) 2015 $ 805 $1,041 903 1.9371.730 $3,235 $2,978 $2,639 2017 2016 Current assets Other assets Total assets Current liabilities Long-term liabilities Stockholders' equity Total liabilities and stockholders' equity 2,430 $ 594 847749 955 935 $3,235 $2,978 $2,639 1,617 1,024 1,088 1,043 WIPER, INC Selected Income Statement and Other Data For the year Ended December 31, 2017 and 2016 (in millions) 2017 2016 Income statement data: Sales Operating income Interest expense Net income $3,067 $2,930 327 82 237 313 101 242 Other data: Average number of common shares outstanding Total dividends paid 48.4 $67.0 54.0 43.0 Required a. Calculate return on investment, based on net income and average total assets, for 2017 and 2016. (Do not round intermediate calculations. Round your answers to 1 decimal place.) 2017 2016 Return on investment
Step by Step Solution

There are 3 Steps involved in it

Step: 1

blur-text-image

Get Instant Access to Expert-Tailored Solutions

See step-by-step solutions with expert insights and AI powered tools for academic success

Step: 2

blur-text-image_2

Step: 3

blur-text-image_3

Ace Your Homework with AI

Get the answers you need in no time with our AI-driven, step-by-step assistance

Get Started

Recommended Textbook for

Market Audit And Analysis

Authors: Nicole Lorat

1st Edition

3640438892, 978-3640438891

More Books

Students also viewed these Accounting questions

Question

Answer clearly

Answered: 1 week ago