

Answered step by step
Verified Expert Solution
Question
1 Approved Answer
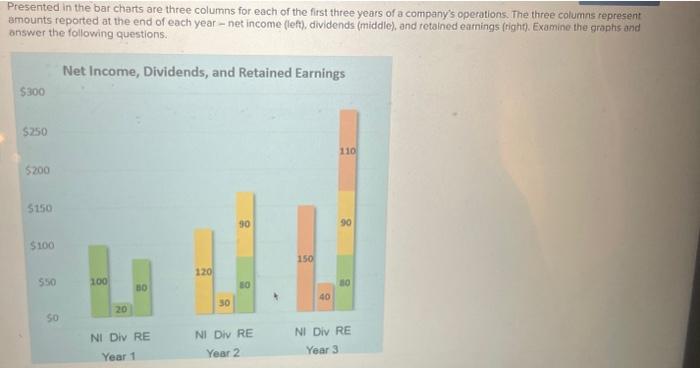
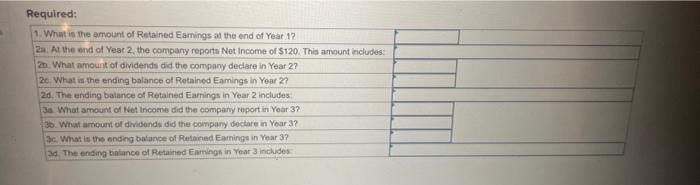
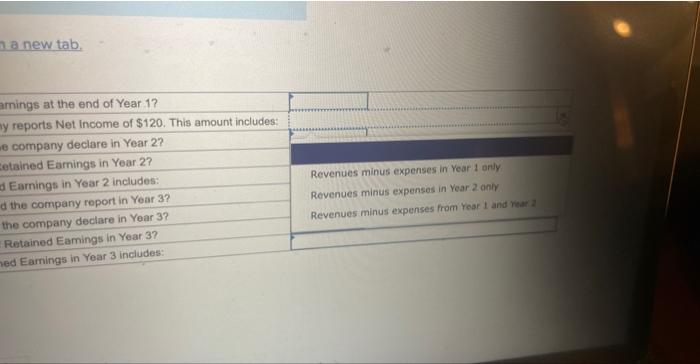
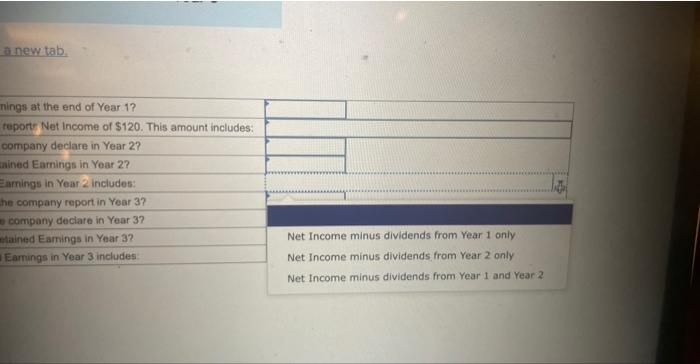
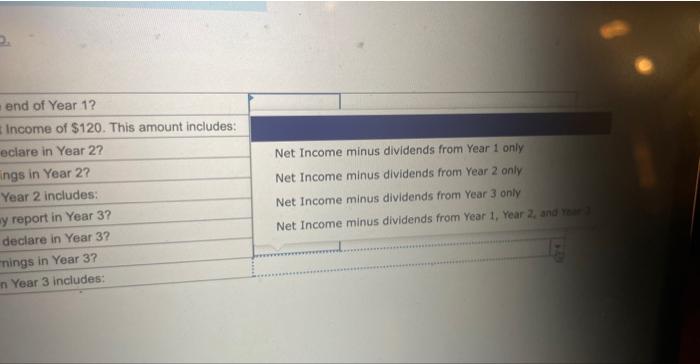
Presented in the bar charts are three columns for each of the first three years of a company's operations. The three columns represent amounts reported
Step by Step Solution
There are 3 Steps involved in it
Step: 1

Get Instant Access to Expert-Tailored Solutions
See step-by-step solutions with expert insights and AI powered tools for academic success
Step: 2

Step: 3
Ace Your Homework with AI
Get the answers you need in no time with our AI-driven, step-by-step assistance
Get Started
Accounting
Authors: Warren S. Carl
23rd Edition
0324555865, 978-0324555868