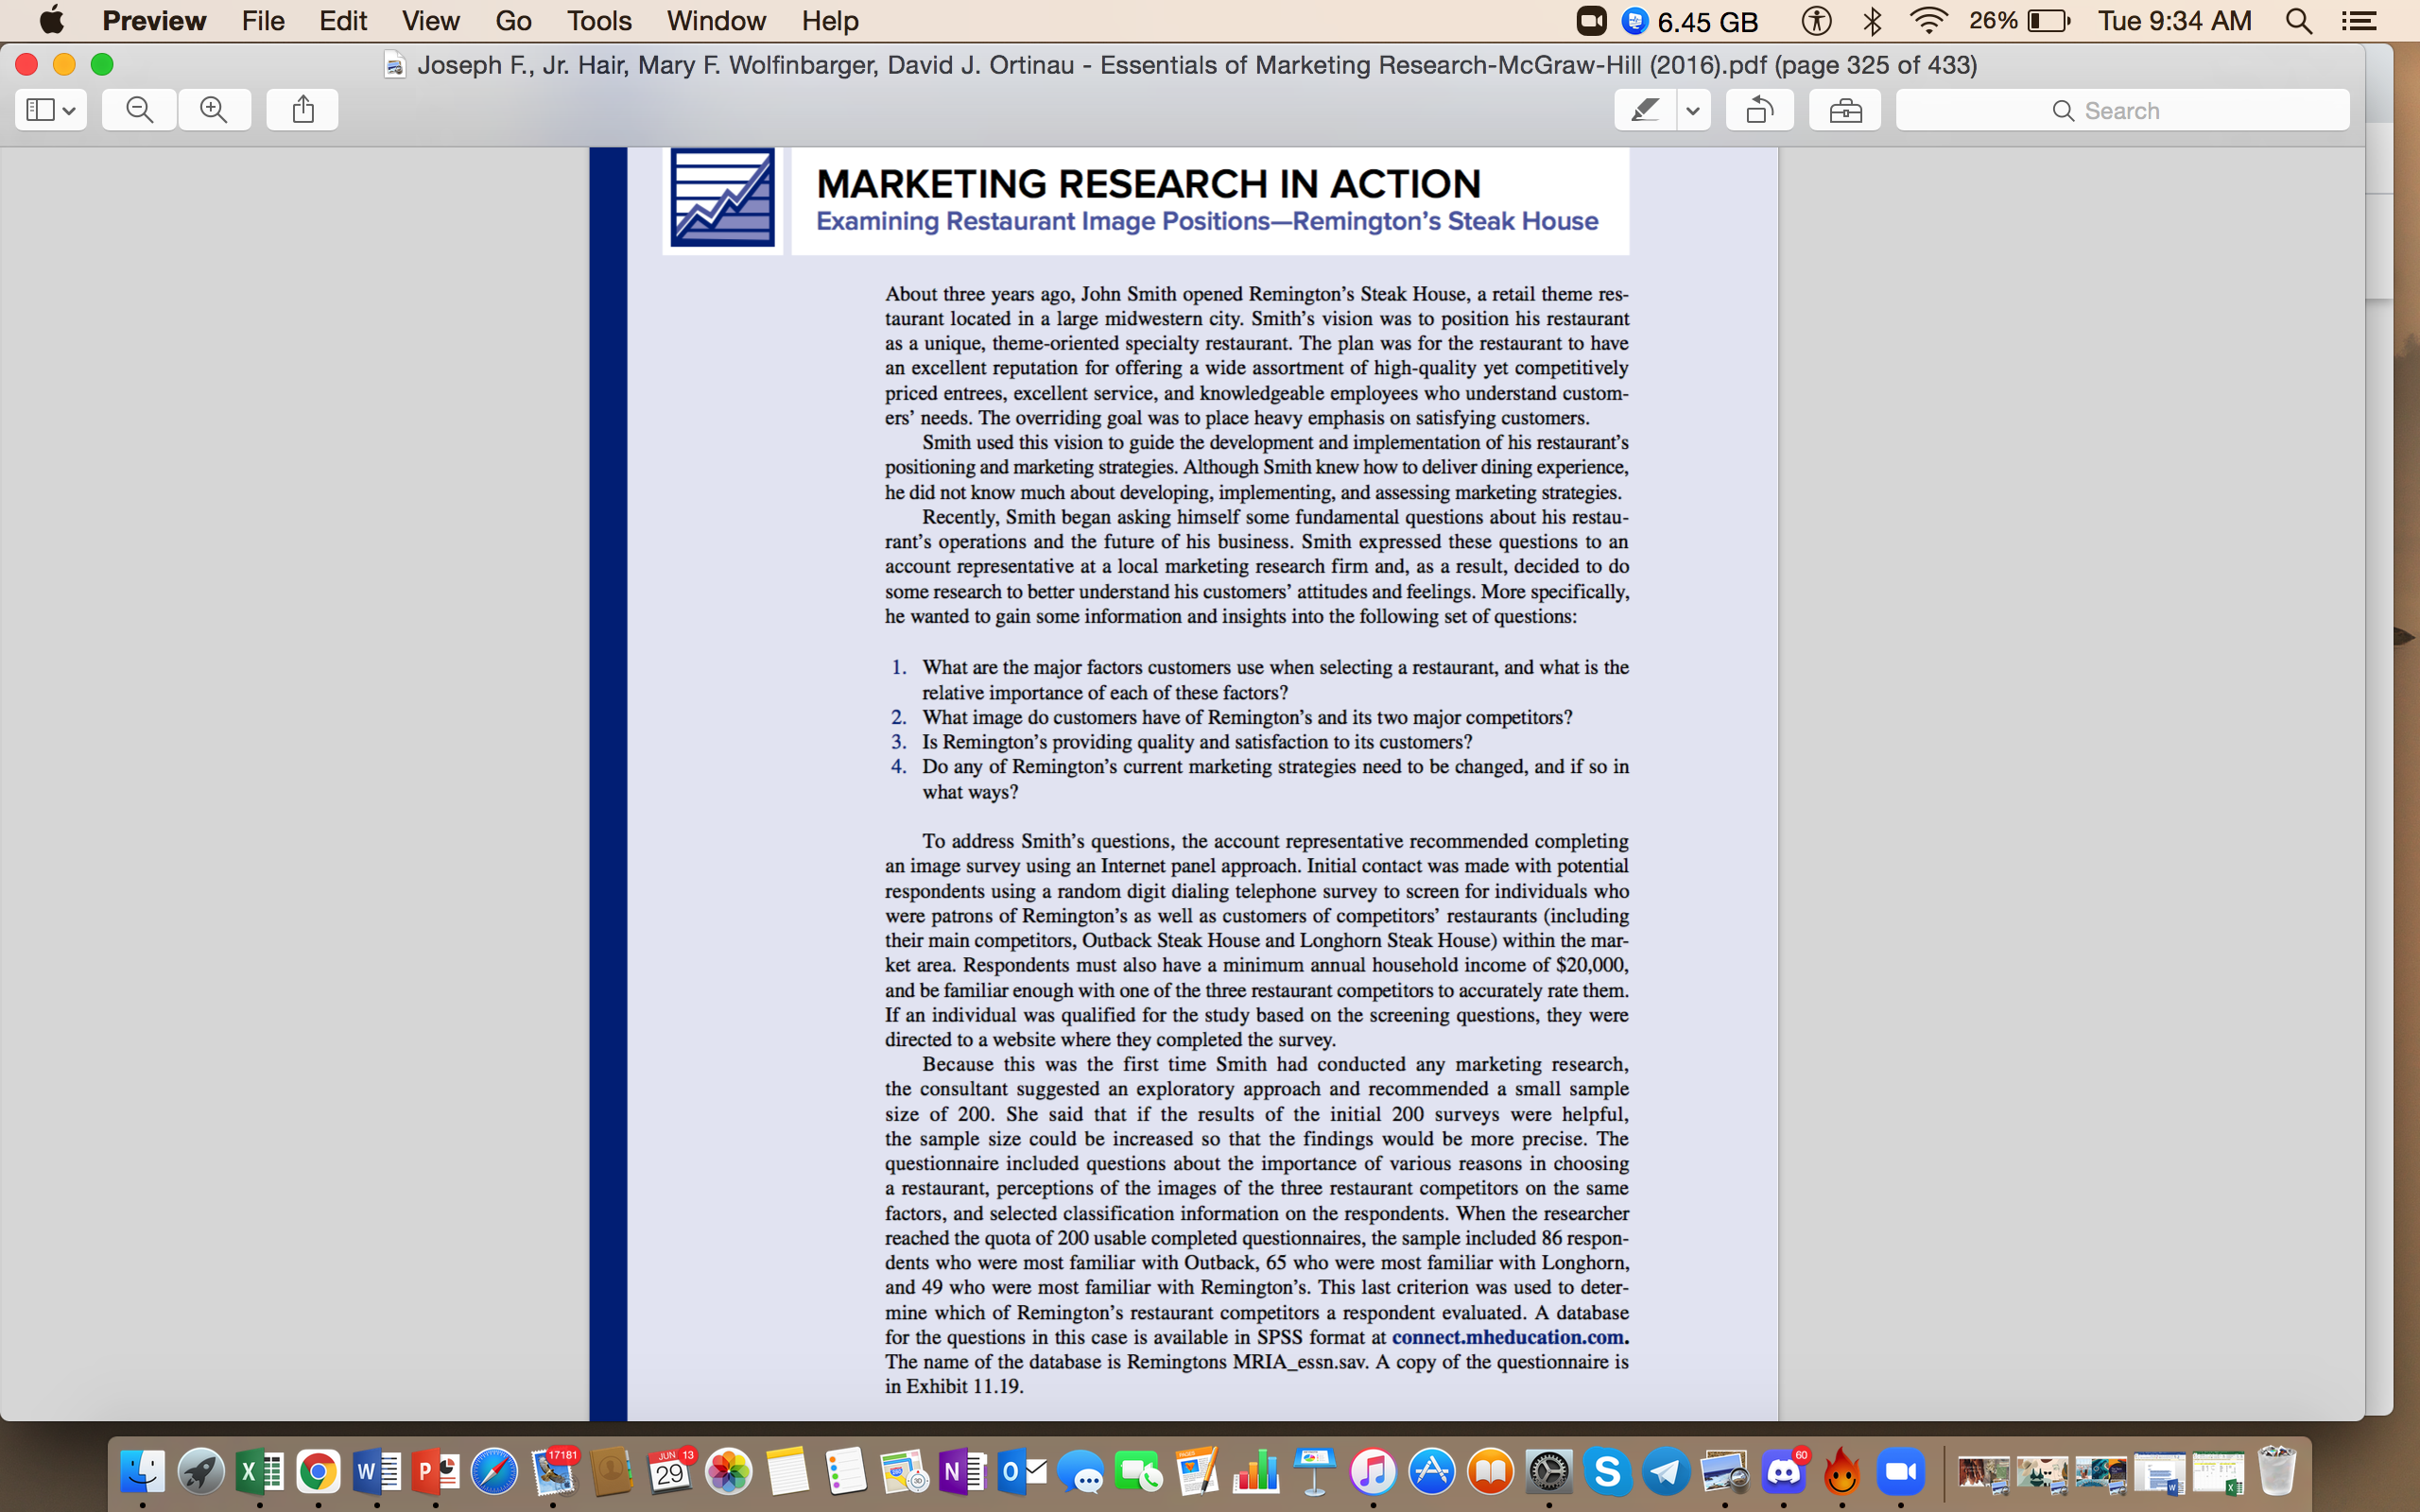
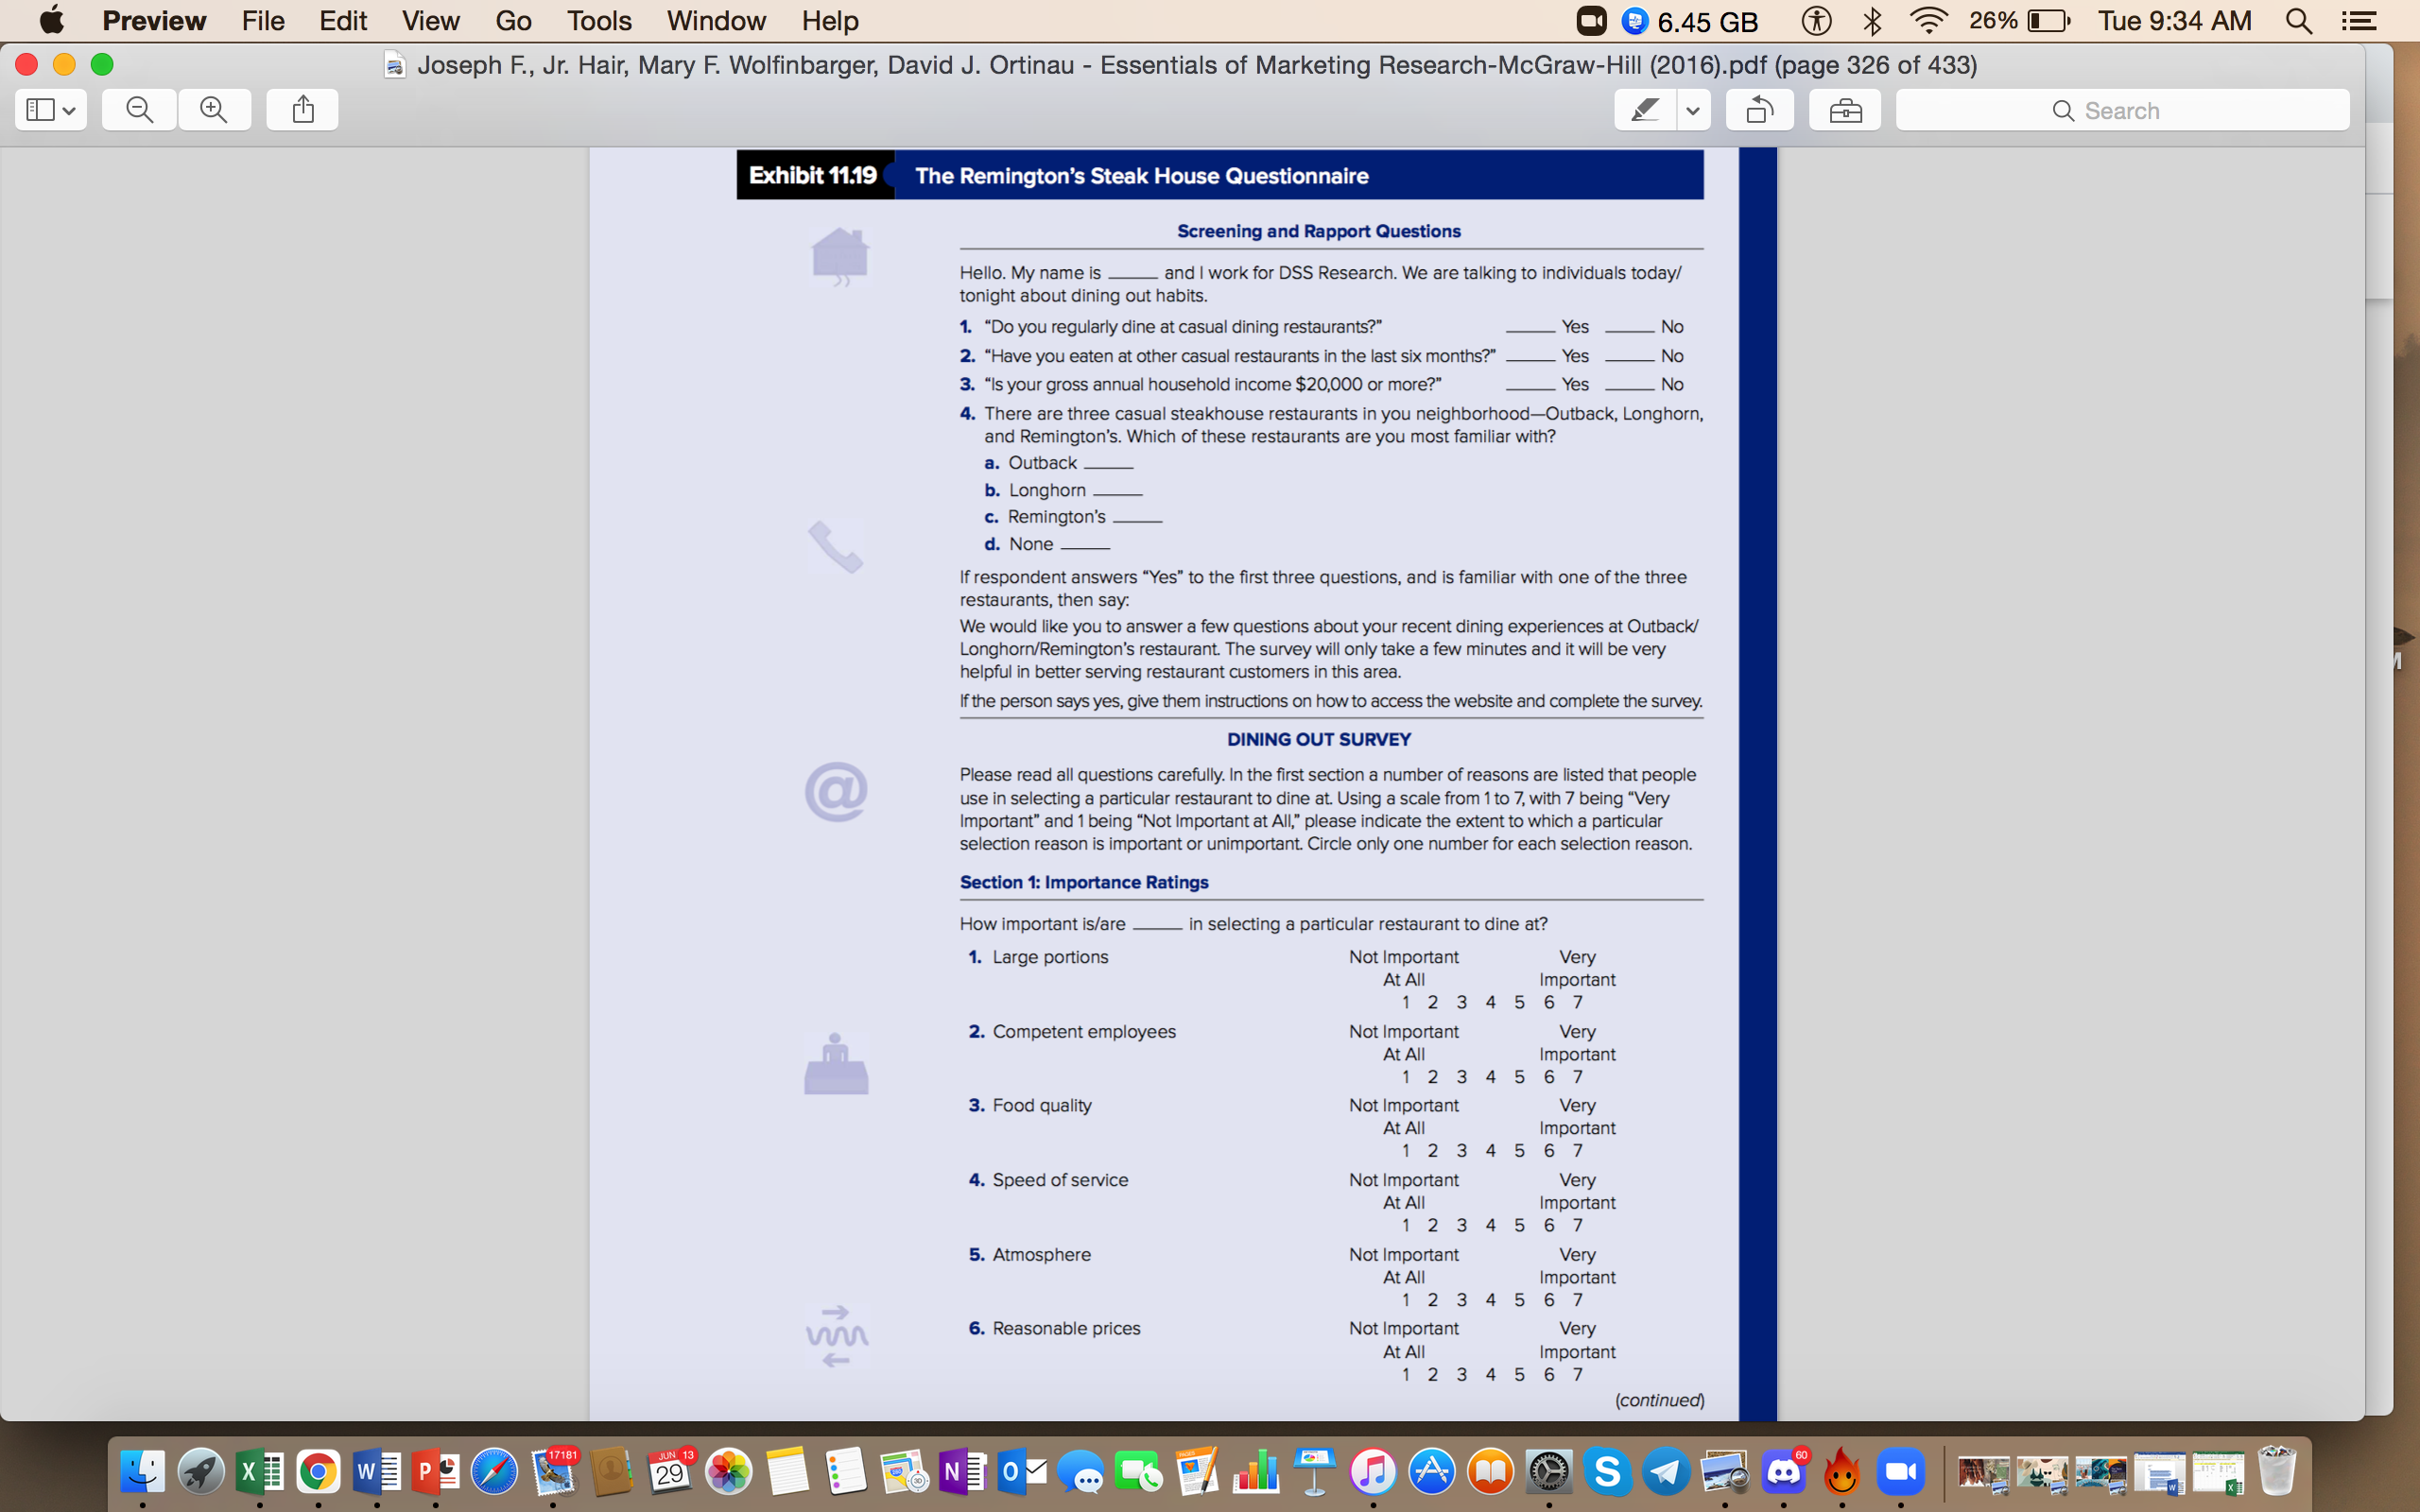
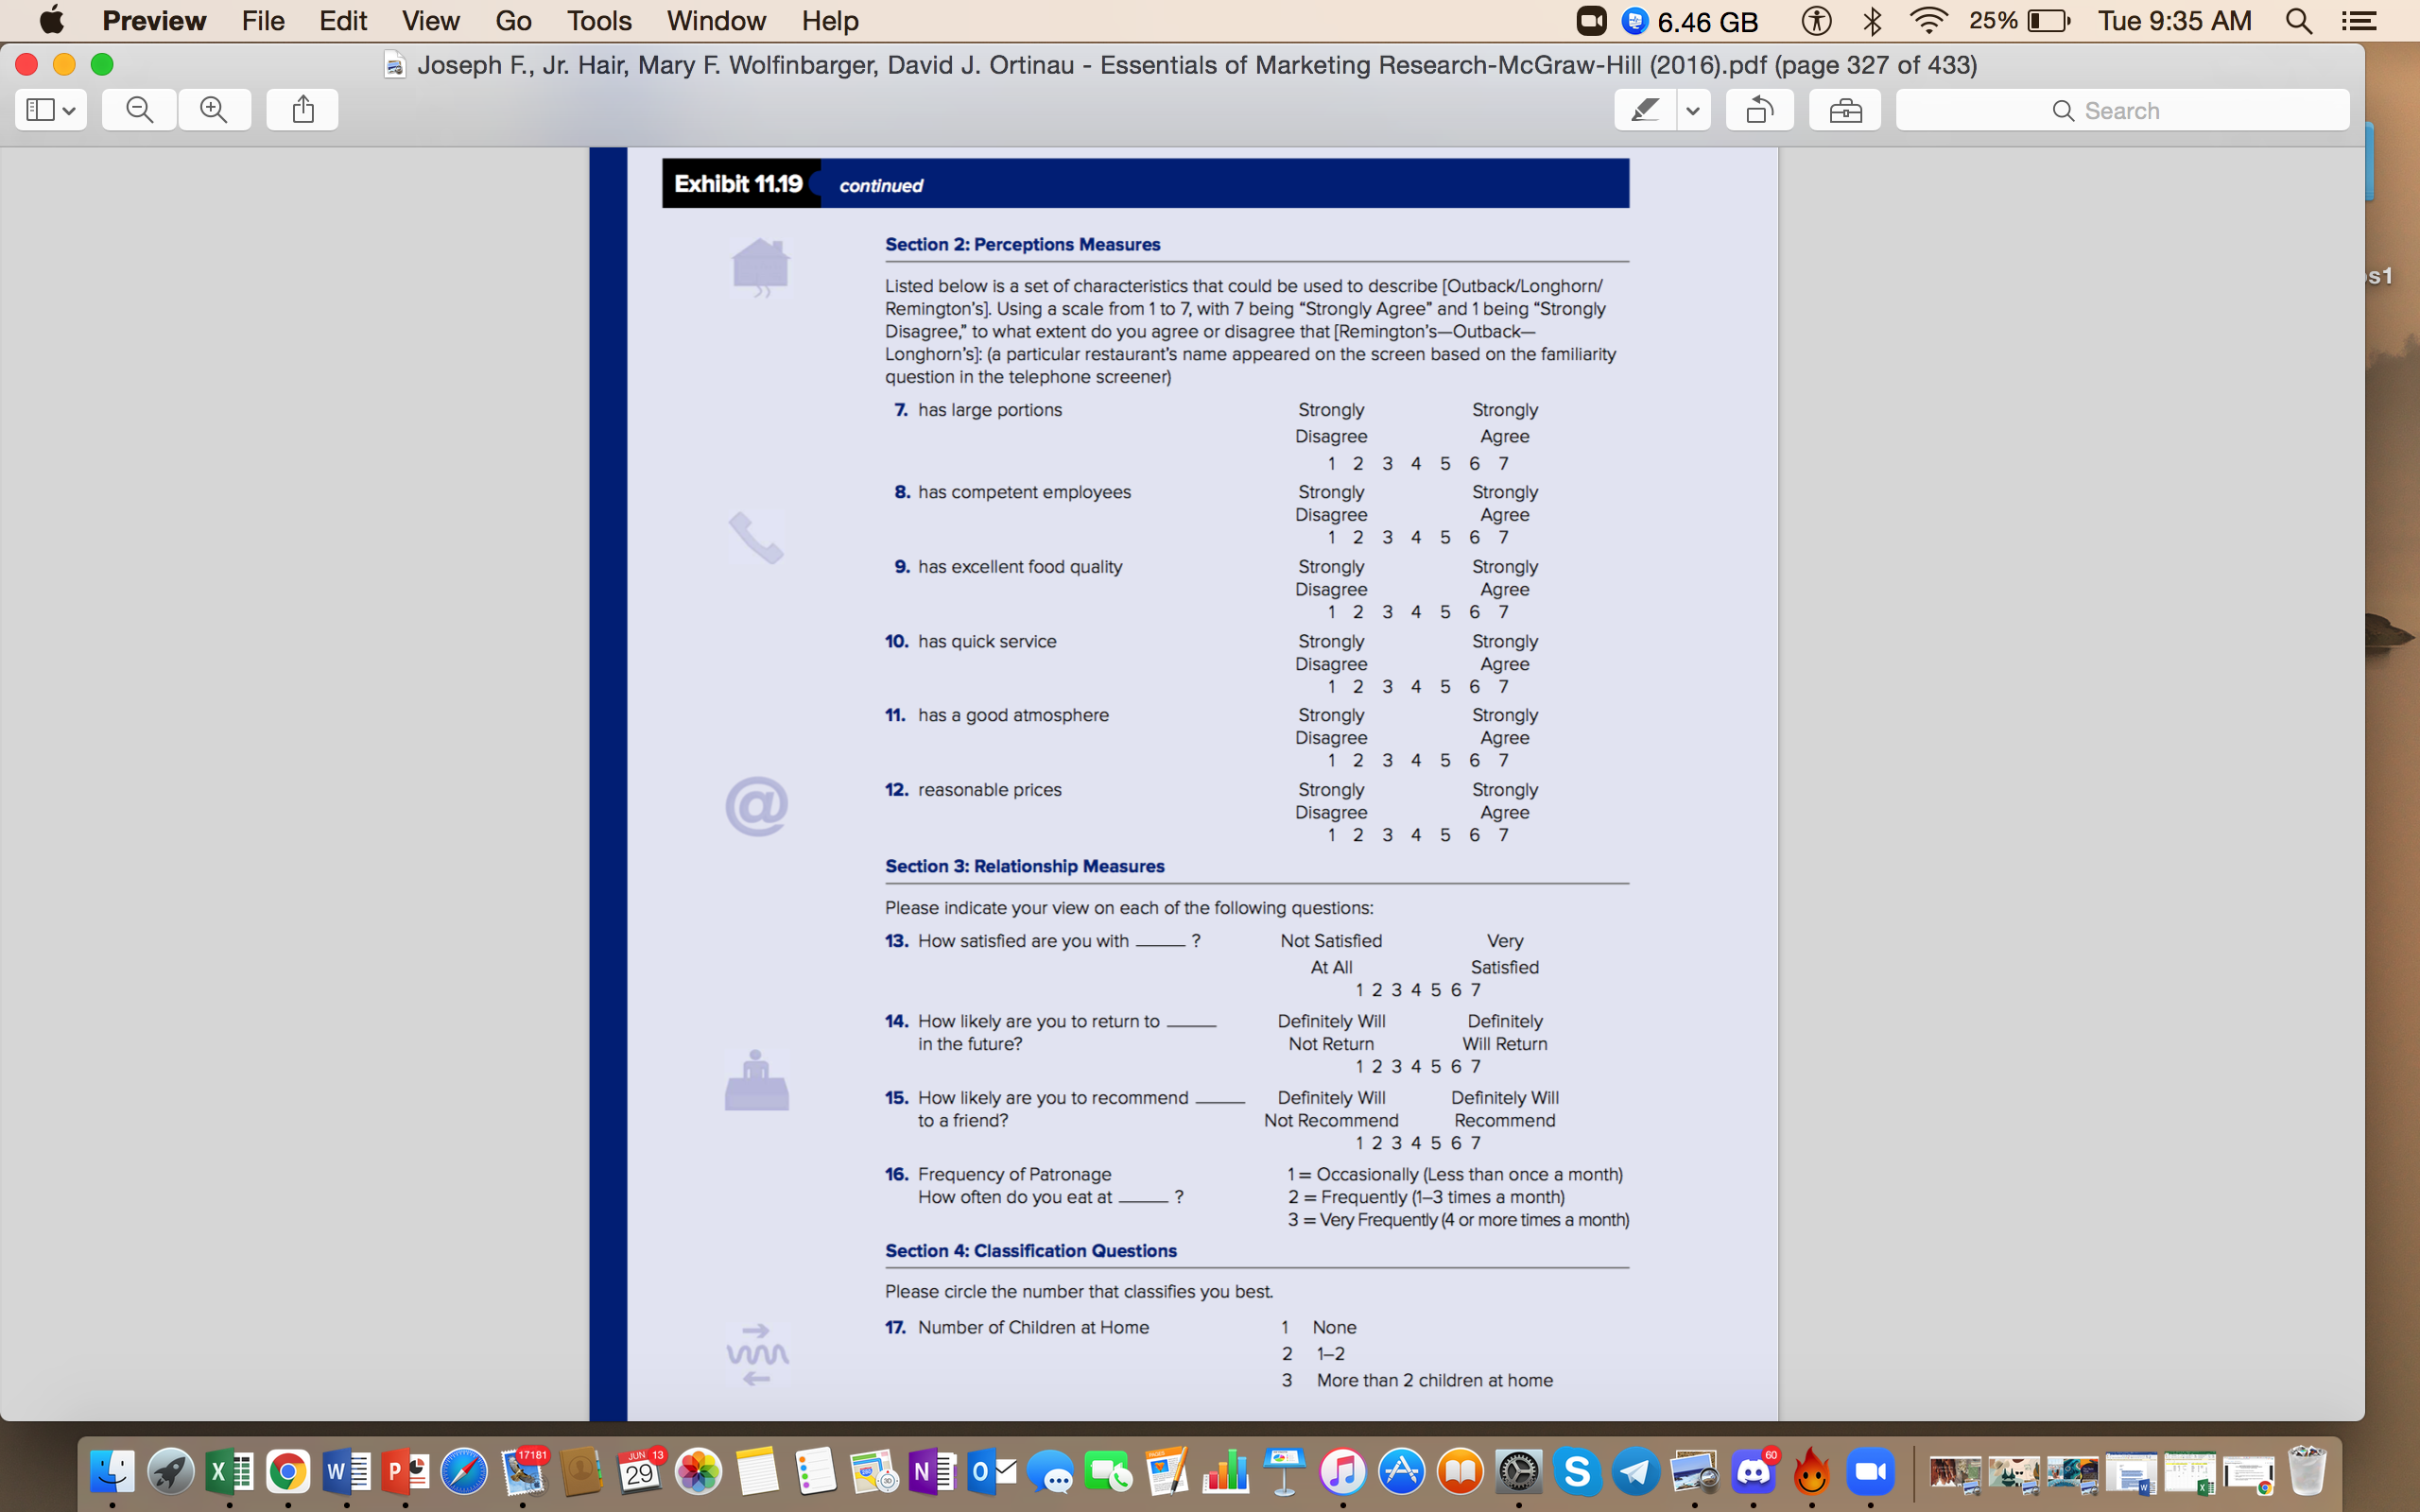
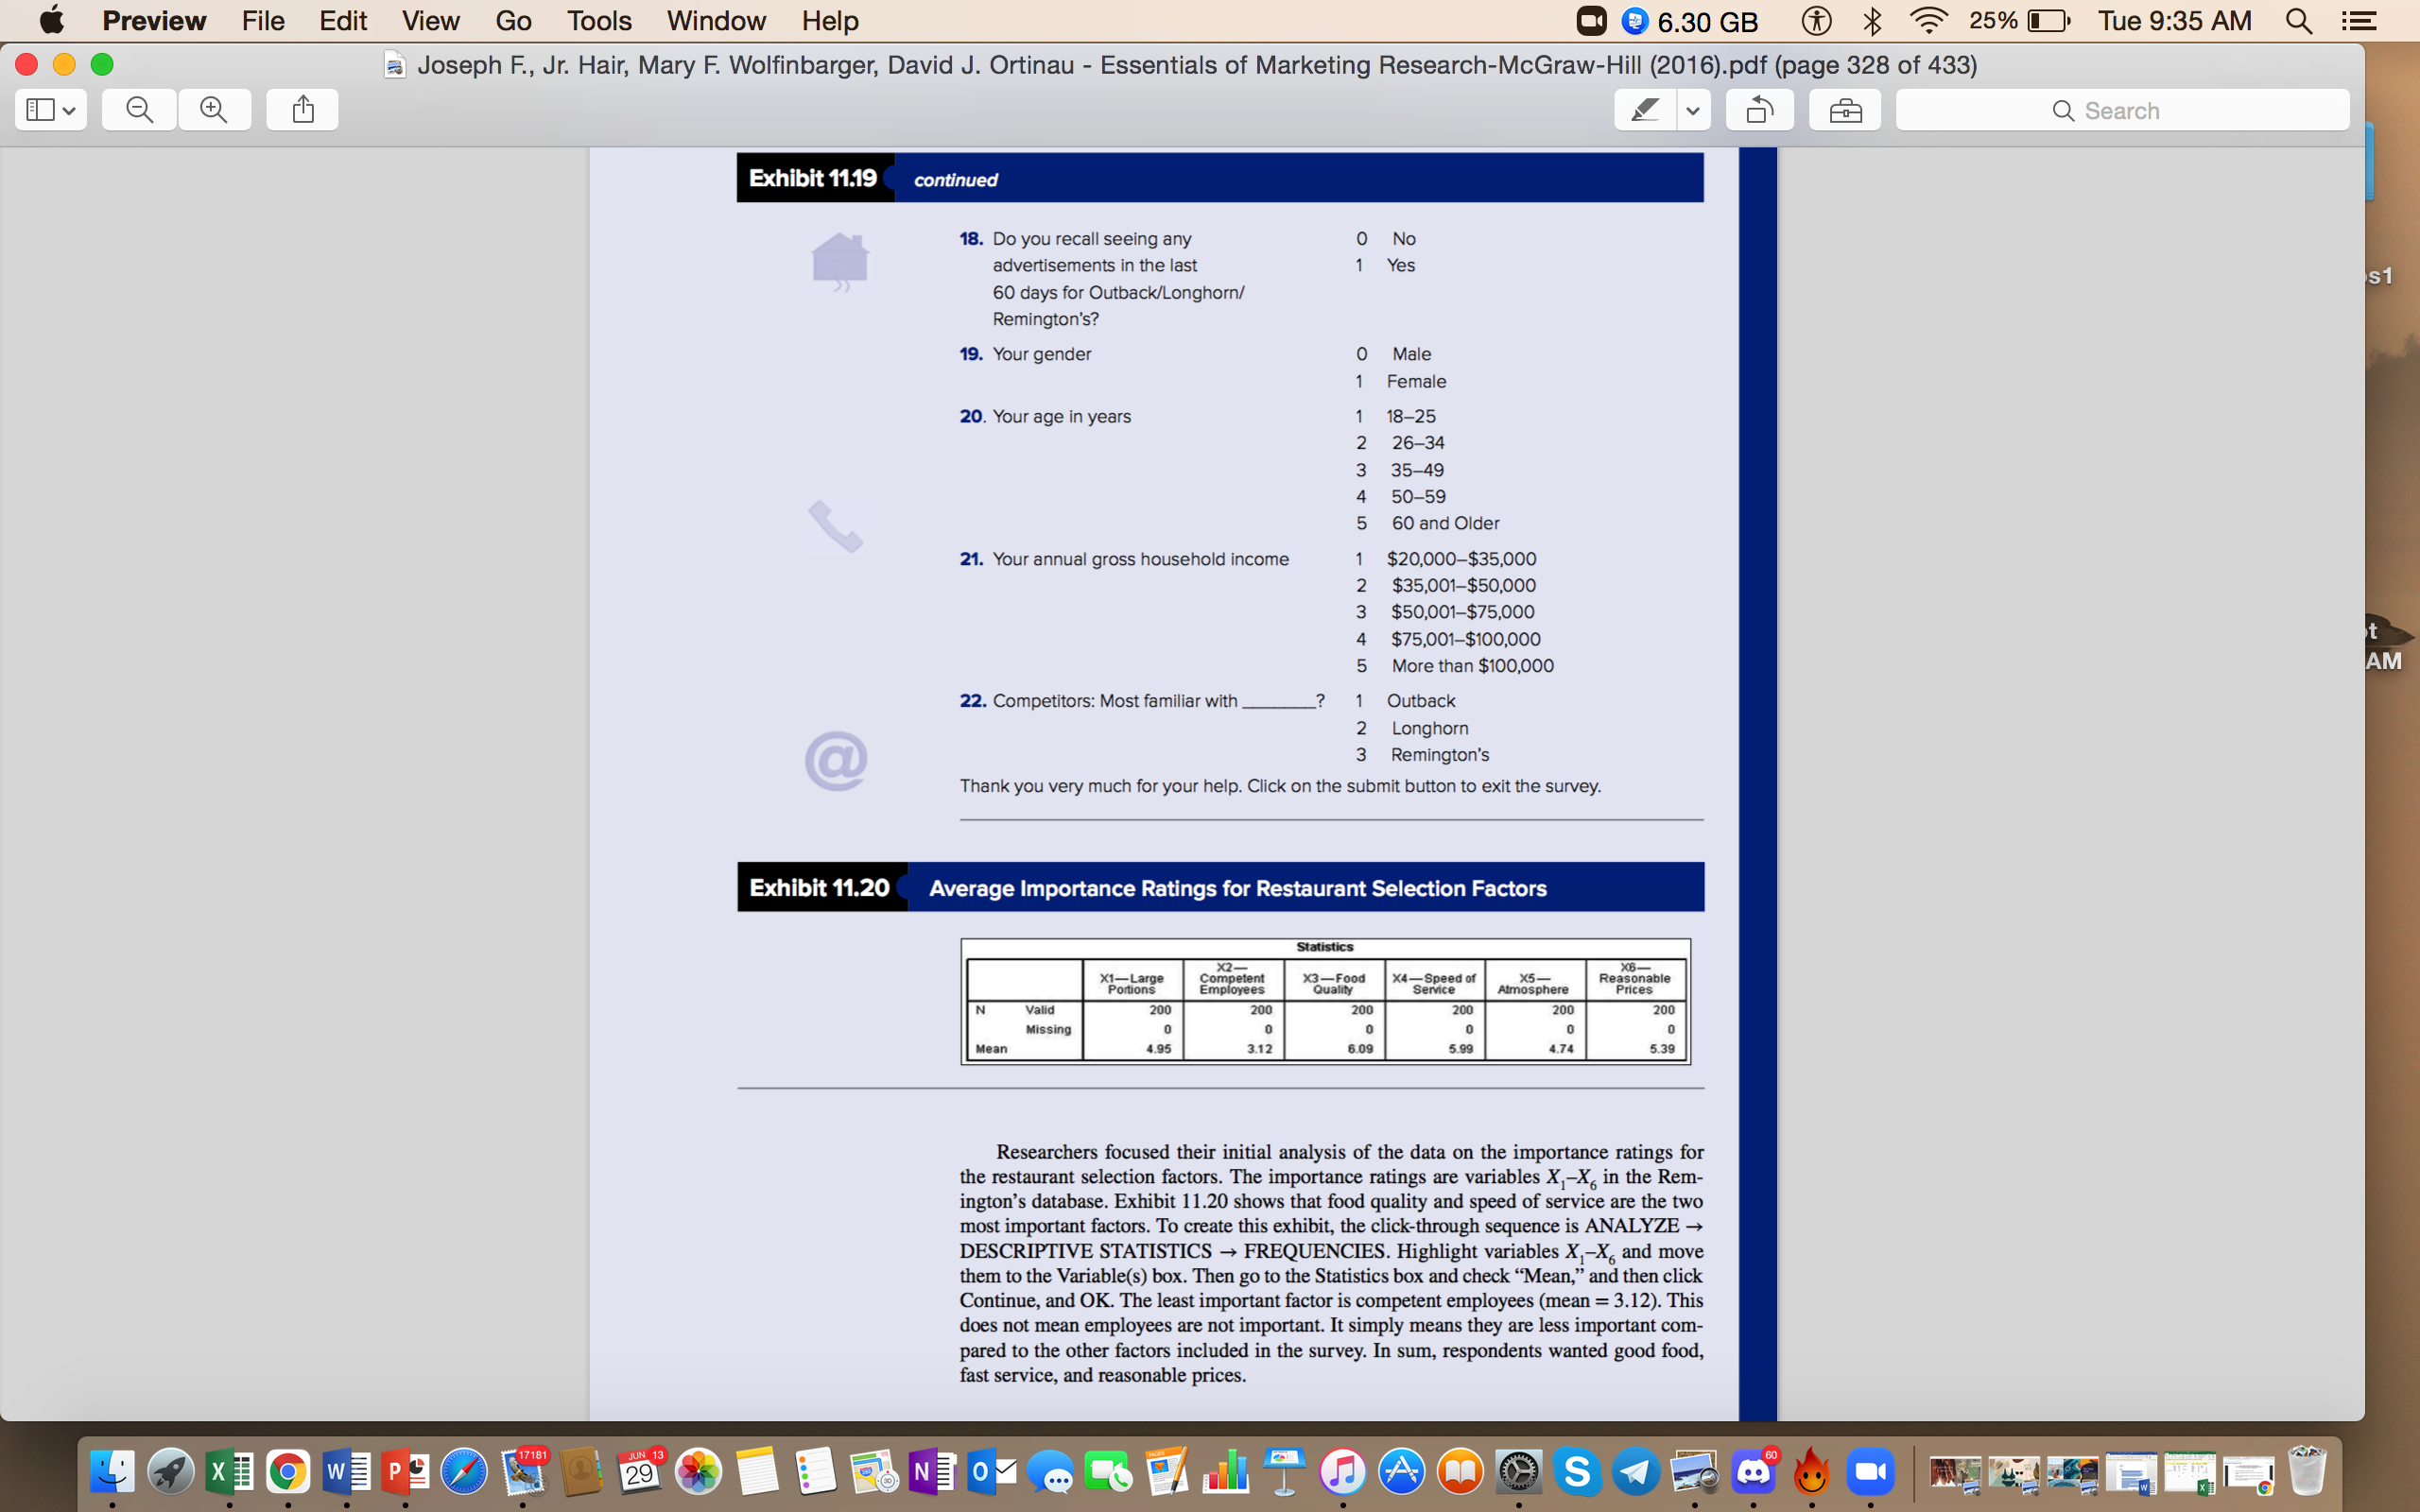
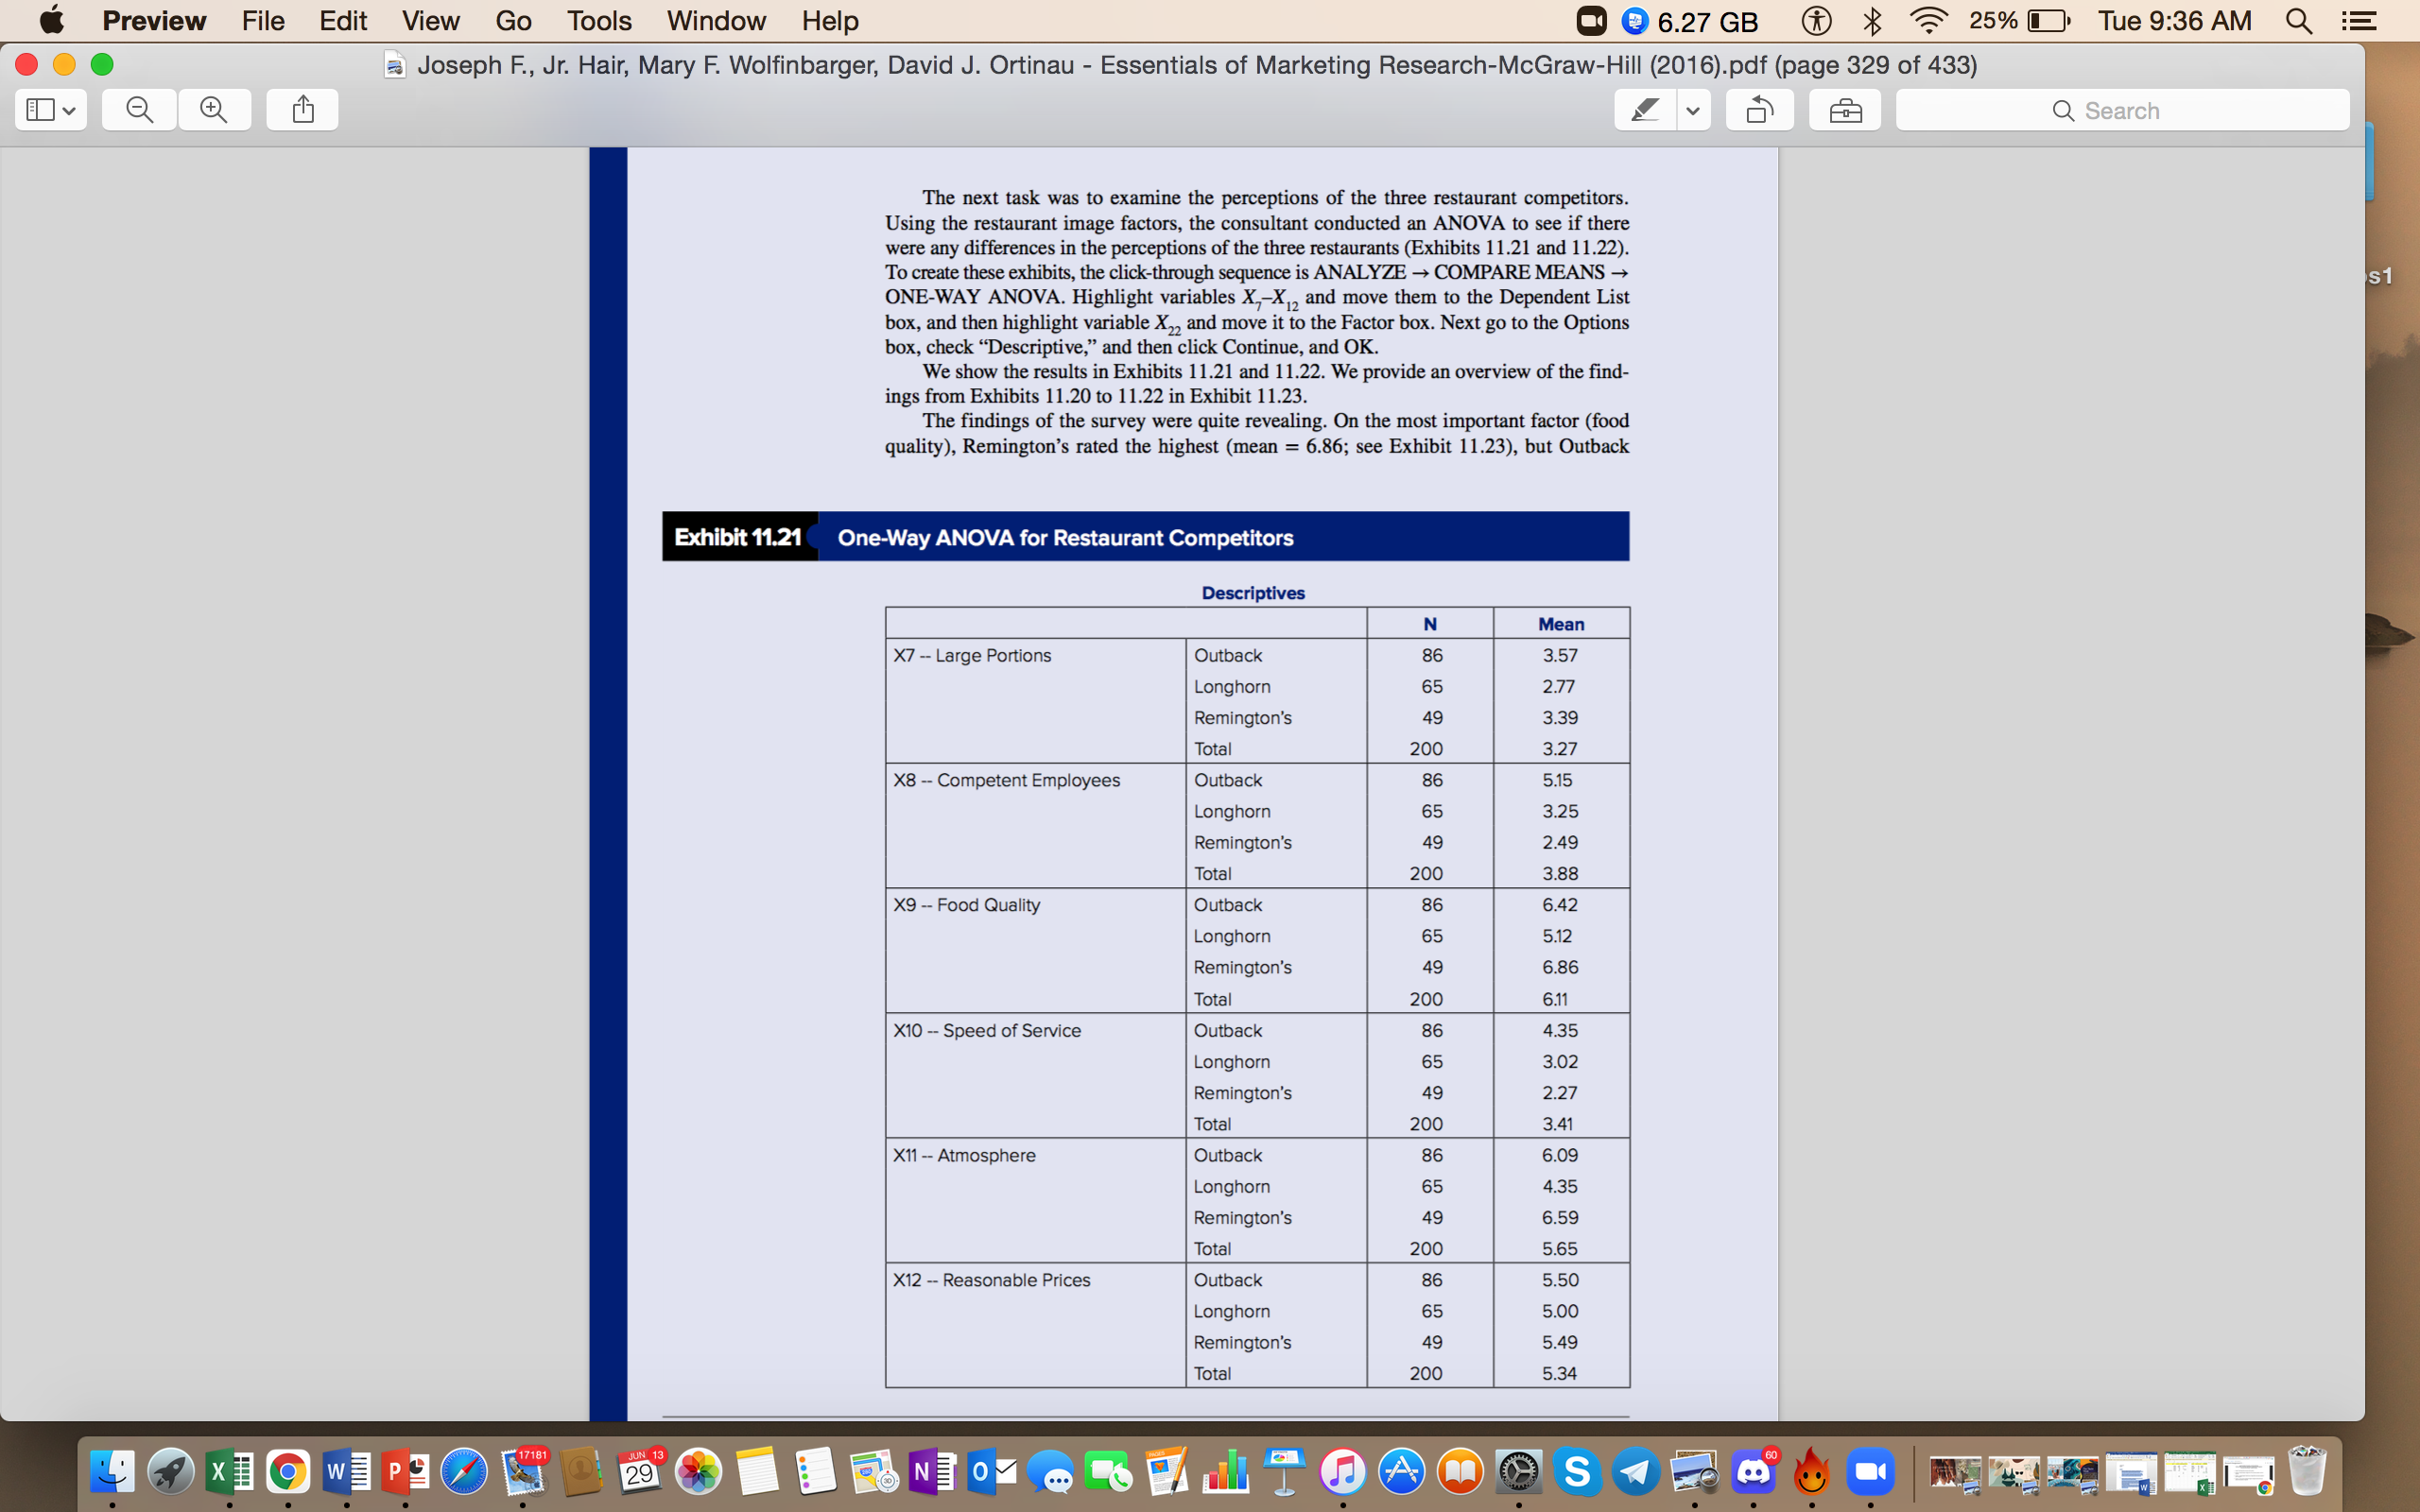
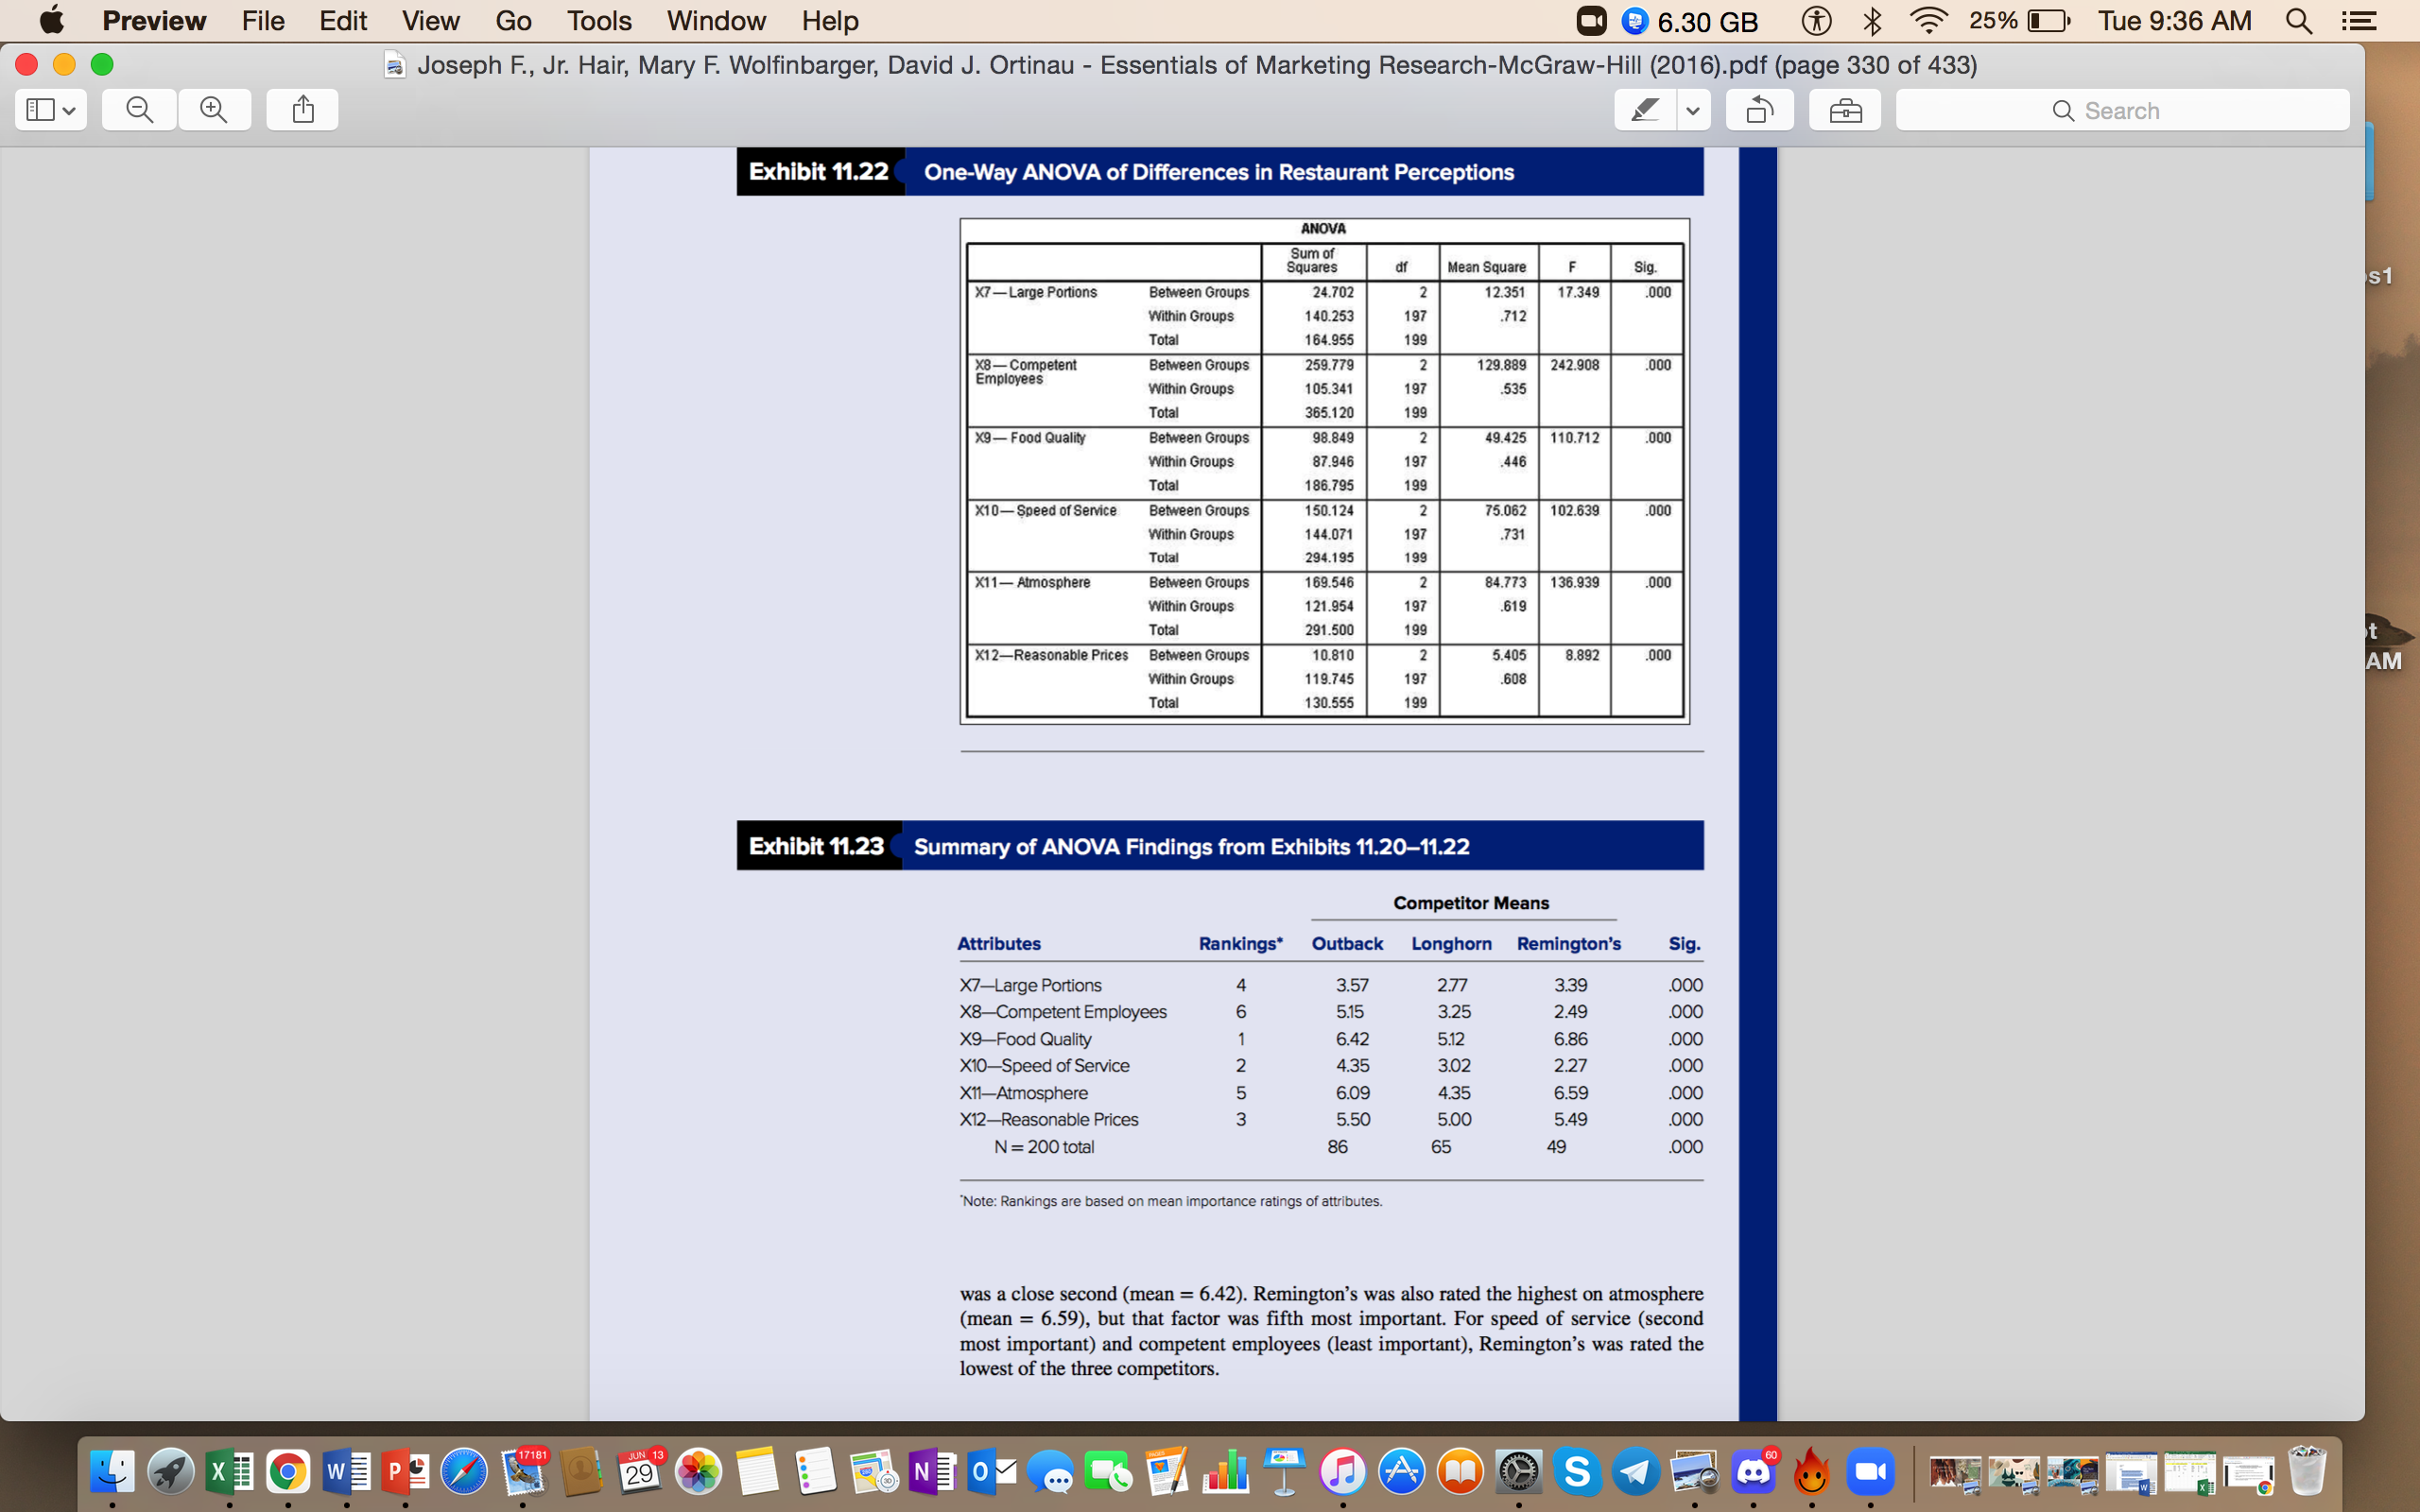
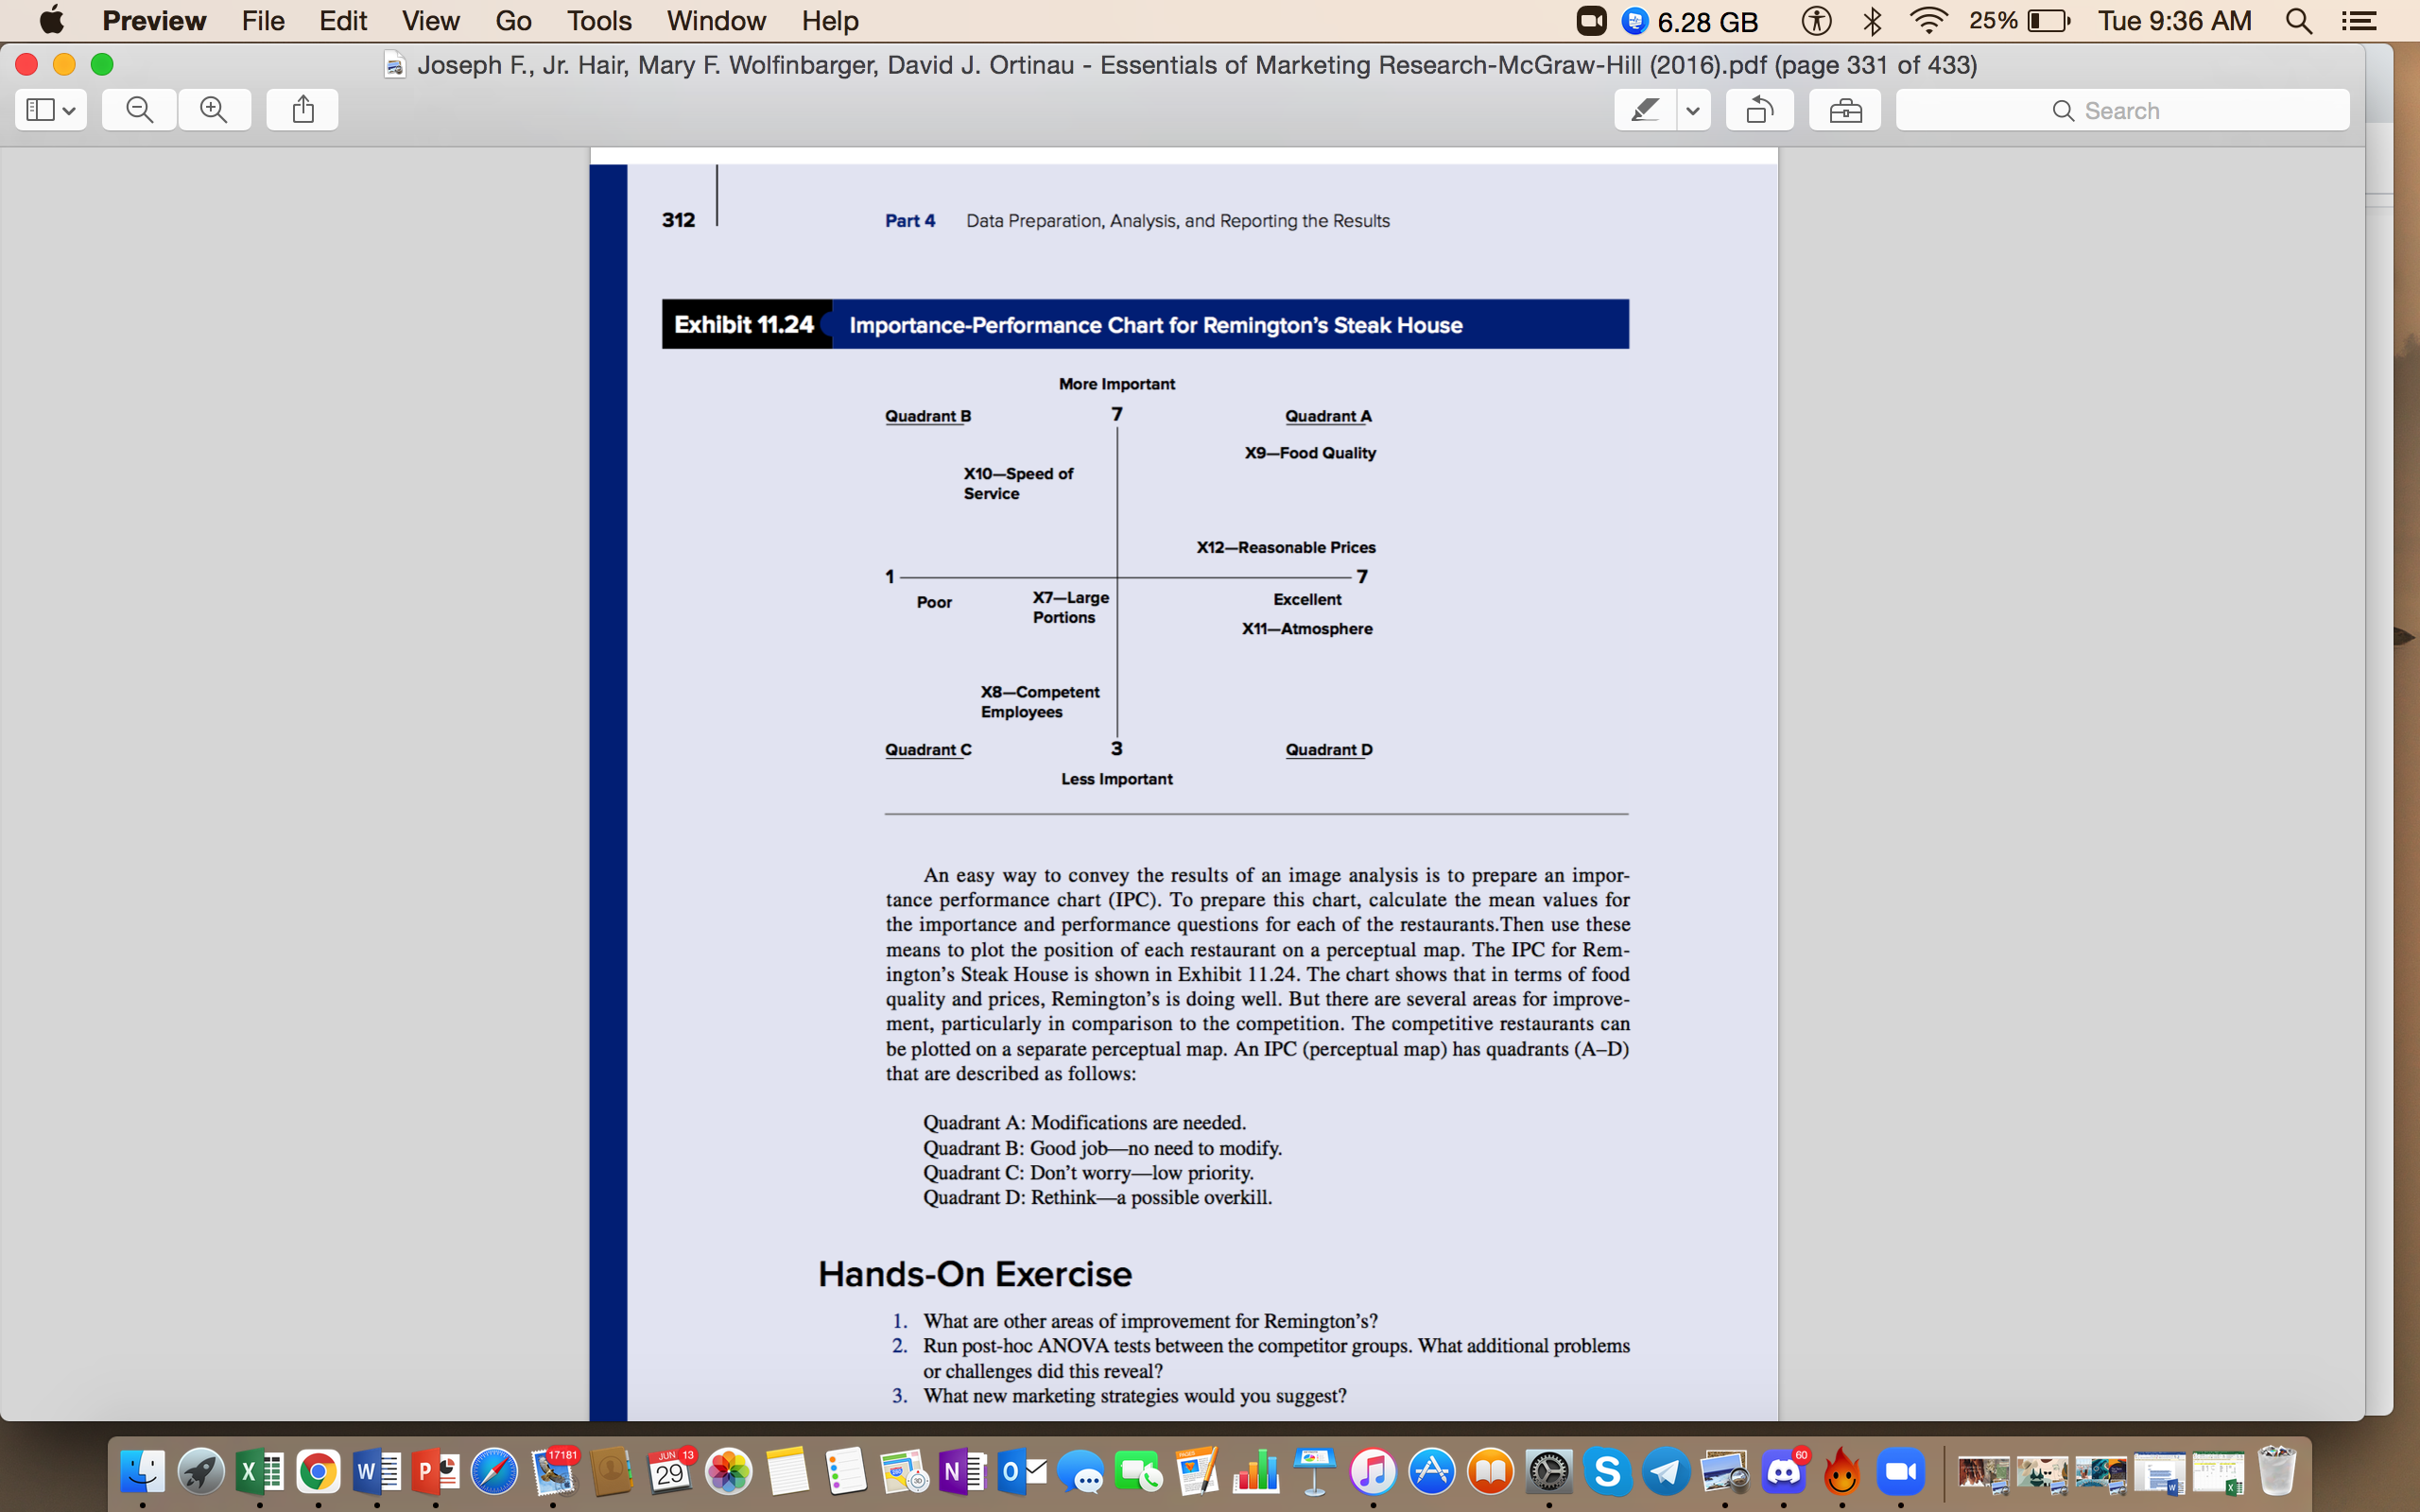
Preview File Edit View Go Tools Window Help 6.45 GB 26% Tue 9:34 AM Q Joseph F., Jr. Hair, Mary F. Wolfinbarger, David J. Ortinau - Essentials of Marketing Research-McGraw-Hill (2016).pdf (page 325 of 433) Q Search MARKETING RESEARCH IN ACTION Examining Restaurant Image Positions-Remington's Steak House About three years ago, John Smith opened Remington's Steak House, a retail theme res- taurant located in a large midwestern city. Smith's vision was to position his restaurant as a unique, theme-oriented specialty restaurant. The plan was for the restaurant to have an excellent reputation for offering a wide assortment of high-quality yet competitively priced entrees, excellent service, and knowledgeable employees who understand custom- ers' needs. The overriding goal was to place heavy emphasis on satisfying customers. Smith used this vision to guide the development and implementation of his restaurant's positioning and marketing strategies. Although Smith knew how to deliver dining experience, he did not know much about developing, implementing, and assessing marketing strategies. Recently, Smith began asking himself some fundamental questions about his restau- rant's operations and the future of his business. Smith expressed these questions to an account representative at a local marketing research firm and, as a result, decided to do some research to better understand his customers' attitudes and feelings. More specifically, he wanted to gain some information and insights into the following set of questions: 1. What are the major factors customers use when selecting a restaurant, and what is the relative importance of each of these factors? .. What image do customers have of Remington's and its two major competitors? 3. Is Remington's providing quality and satisfaction to its customers? 4. Do any of Remington's current marketing strategies need to be changed, and if so in what ways? To address Smith's questions, the account representative recommended completing an image survey using an Internet panel approach. Initial contact was made with potential respondents using a random digit dialing telephone survey to screen for individuals who were patrons of Remington's as well as customers of competitors' restaurants (including their main competitors, Outback Steak House and Longhorn Steak House) within the mar- ket area. Respondents must also have a minimum annual household income of $20,000, and be familiar enough with one of the three restaurant competitors to accurately rate them. If an individual was qualified for the study based on the screening questions, they were directed to a website where they completed the survey Because this was the first time Smith had conducted any marketing research, the consultant suggested an exploratory approach and recommended a small sample size of 200. She said that if the results of the initial 200 surveys were helpful, the sample size could be increased so that the findings would be more precise. The questionnaire included questions about the importance of various reasons in choosing a restaurant, perceptions of the images of the three restaurant competitors on the same factors, and selected classification information on the respondents. When the researcher reached the quota of 200 usable completed questionnaires, the sample included 86 respon dents who were most familiar with Outback, 65 who were most familiar with Longhorn, and 49 who were most familiar with Remington's. This last criterion was used to deter- mine which of Remington's restaurant competitors a respondent evaluated. A database for the questions in this case is available in SPSS format at connect.mheducation.com. The name of the database is Remingtons MRIA_essn.sav. A copy of the questionnaire is in Exhibit 11.19. JUN 13 29Preview File Edit View Go Tools Window Help 6.45 GB 26% Tue 9:34 AM Q Joseph F., Jr. Hair, Mary F. Wolfinbarger, David J. Ortinau - Essentials of Marketing Research-McGraw-Hill (2016).pdf (page 326 of 433) Q Search Exhibit 11.19 The Remington's Steak House Questionnaire Screening and Rapport Questions Hello. My name is - and I work for DSS Research. We are talking to individuals today/ tonight about dining out habits. 1. "Do you regularly dine at casual dining restaurants?" Yes No 2. "Have you eaten at other casual restaurants in the last six months?" Yes No 3. "Is your gross annual household income $20,000 or more?" Yes No 4. There are three casual steakhouse restaurants in you neighborhood-Outback, Longhorn, and Remington's. Which of these restaurants are you most familiar with? a. Outback _ b. Longhorn c. Remington's d. None If respondent answers "Yes" to the first three questions, and is familiar with one of the three restaurants, then say: We would like you to answer a few questions about your recent dining experiences at Outback/ Longhorn/Remington's restaurant. The survey will only take a few minutes and it will be very helpful in better serving restaurant customers in this area. If the person says yes, give them instructions on how to access the website and complete the survey. DINING OUT SURVEY Please read all questions carefully. In the first section a number of reasons are listed that people use in selecting a particular restaurant to dine at. Using a scale from 1 to 7, with 7 being "Very Important" and 1 being "Not Important at All," please indicate the extent to which a particular selection reason is important or unimportant. Circle only one number for each selection reason. Section 1: Importance Ratings How important is/are in selecting a particular restaurant to dine at? 1. Large portions Not Important Very At All Important 2 3 4 5 6 7 2. Competent employees Not Important Very At All Important 2 3 4 6 7 3. Food quality Not Important Very At All Important 2 3 4 5 6 7 4. Speed of service Not Important Very At All Important 2 3 4 5 6 7 5. Atmosphere Not Important Very At All Important 2 3 4 5 6 7 onable price Not Important Very At All Important 2 3 4 5 6 7 (continued) X 19 WP JUN 13 29 A SPreview File Edit View Go Tools Window Help 6.46 GB $ 25% Tue 9:35 AM Q Joseph F., Jr. Hair, Mary F. Wolfinbarger, David J. Ortinau - Essentials of Marketing Research-McGraw-Hill (2016).pdf (page 327 of 433) I V Q Search Exhibit 11.19 continued Section 2: Perceptions Measures s1 Listed below is a set of characteristics that could be used to describe [Outback/Longhorn/ Remington's]. Using a scale from 1 to 7, with 7 being "Strongly Agree" and 1 being "Strongly Disagree," to what extent do you agree or disagree that [Remington's-Outback- Longhorn's]: (a particular restaurant's name appeared on the screen based on the familiarity question in the telephone screener) 7. has large portions Strongly Strongly Disagree Agree 1 2 3 4 5 6 7 8. has competent employees Strongly Strongly Disagree Agree 2345 6 7 9. has excellent food quality Strongly Strongly Disagree Agree 1 2 3 4 5 6 7 10. has quick service Strongly Strongly Disagree Agree 2 3 4 5 6 7 11. has a good atmosphere Strongly Strongly Disagree Agree 2 3 4 5 6 12. reasonable prices Strongly Strongly Disagree Agree 3 5 6 Section 3: Relationship Measures Please indicate your view on each of the following questions: 13. How satisfied are you with Not Satisfied Very At All Satisfied 1234 5 6 7 14. How likely are you to return to Definitely Will Definitely in the future? Not Return Will Return 1234 5 6 7 15. How likely are you to recommend Definitely Will Definitely Will to a friend? Not Recommend Recommend 12 3 4 5 6 7 16. Frequency of Patronage 1 = Occasionally (Less than once a month) How often do you eat at _ 2 = Frequently (1-3 times a month) 3 = Very Frequently (4 or more times a month) Section 4: Classification Questions Please circle the number that classifies you best. 17. Number of Children at Home 1 None 2 1-2 More than 2 children at home SIO WP JUN 13 29 A SPreview File Edit View Go Tools Window Help 6.30 GB 25% Tue 9:35 AM Q Joseph F., Jr. Hair, Mary F. Wolfinbarger, David J. Ortinau - Essentials of Marketing Research-McGraw-Hill (2016).pdf (page 328 of 433) Q Search Exhibit 11.19 continued 18. Do you recall seeing any 0 No advertisements in the last 1 Yes s1 60 days for Outback/Longhorn/ Remington's? 19. Your gender Male 1 Female 20. Your age in years 18-25 2 26-34 w 35-49 4 50-59 5 60 and Older 21. Your annual gross household income $20,000-$35,000 $35,001-$50,000 $50,001-$75,000 4 $75,001-$100,000 5 More than $100,000 AM 22. Competitors: Most familiar with 1 Outback 2 Longhorn 3 Remington's Thank you very much for your help. Click on the submit button to exit the survey. Exhibit 11.20 Average Importance Ratings for Restaurant Selection Factors Statistics Comptent Reasonable Portions Employees x3-Food Service Atmosphere Prices N Valid 200 Missing Mean Researchers focused their initial analysis of the data on the importance ratings for the restaurant selection factors. The importance ratings are variables X1-X in the Rem- ington's database. Exhibit 11.20 shows that food quality and speed of service are the two most important factors. To create this exhibit, the click-through sequence is ANALYZE - DESCRIPTIVE STATISTICS - FREQUENCIES. Highlight variables X,-X and move them to the Variable(s) box. Then go to the Statistics box and check "Mean," and then click Continue, and OK. The least important factor is competent employees (mean = 3.12). This does not mean employees are not important. It simply means they are less important com- pared to the other factors included in the survey. In sum, respondents wanted good food, fast service, and reasonable prices. JUN 13 29 A SPreview File Edit View Go Tools Window Help 6.27 GB 25% Tue 9:36 AM Q Joseph F., Jr. Hair, Mary F. Wolfinbarger, David J. Ortinau - Essentials of Marketing Research-McGraw-Hill (2016).pdf (page 329 of 433) Q Search The next task was to examine the perceptions of the three restaurant competitors. Using the restaurant image factors, the consultant conducted an ANOVA to see if there were any differences in the perceptions of the three restaurants (Exhibits 11.21 and 11.22). To create these exhibits, the click-through sequence is ANALYZE - COMPARE MEANS - s1 ONE-WAY ANOVA. Highlight variables X,-X12 and move them to the Dependent List box, and then highlight variable X22 and move it to the Factor box. Next go to the Options box, check "Descriptive," and then click Continue, and OK. We show the results in Exhibits 11.21 and 11.22. We provide an overview of the find- ings from Exhibits 11.20 to 11.22 in Exhibit 11.23. The findings of the survey were quite revealing. On the most important factor (food quality), Remington's rated the highest (mean = 6.86; see Exhibit 11.23), but Outback Exhibit 11.21 One-Way ANOVA for Restaurant Competitors Descriptives N Mean X7 -- Large Portions Outback 3.57 Longhorn 65 2.77 Remington's 49 3.39 Total 200 3.27 X8 - Competent Employees Outback 5.15 Longhorn 65 3.25 Remington's 49 2.49 Total 200 3.88 X9 -- Food Quality Outback 86 6.42 Longhorn 65 5.12 Remington's 19 6.86 Total 200 6.11 X10 -- Speed of Service Outback 86 4.35 Longhorn 65 3.02 Remington's 49 2.27 Total 200 3.41 X11 -- Atmosphere Outback 86 6.09 Longhorn 65 4.35 Remington's 49 6.59 Total 200 5.65 X12 -- Reasonable Prices Outback 86 5.50 Longhorn 65 5.00 Remington's 49 5.49 Total 200 5.34 JUN 13 29 Null APreview File Edit View Go Tools Window Help 6.30 GB 25% Tue 9:36 AM Q Joseph F., Jr. Hair, Mary F. Wolfinbarger, David J. Ortinau - Essentials of Marketing Research-McGraw-Hill (2016).pdf (page 330 of 433) Q Search Exhibit 11.22 One-Way ANOVA of Differences in Restaurant Perceptions ANOVA Squares Mean Square Sig. s1 X7 -Large Portions Between Groups 24.702 12.351 17.349 000 Within Groups 140.253 197 .712 Total 164.955 199 X8- Competent Between Groups 259.779 2 129.889 242.908 000 Employees Within Groups 105.341 197 535 Total 65.120 190 X9- Food Quality Between Groups 98.849 49.425 110.712 000 Within Groups 87.946 197 446 Total 186.79 199 X10- Speed of Service Between Groups 150.124 75.062 102.639 000 Within Groups 144.07 197 731 Total 294.195 199 X11- Atmosphere Between Groups 169.546 2 84.773 136.939 000 Within Groups 121.95 197 619 Total 291.500 190 X12-Reasonable Prices Between Groups 10.810 5.405 8.892 000 AM Within Groups 119.74 197 .608 Tota 130.555 199 Exhibit 11.23(Summary of ANOVA Findings from Exhibits 11.20-11.22 Competitor Means Attributes Rankings* Outback Longhorn Remington's Sig. X7-Large Portions 3.57 3.39 .000 X8-Competent Employees 515 3.25 2.49 .000 X9-Food Quality J - 6.42 5.12 6.86 .000 X10-Speed of Service 4.35 3.02 2.27 X11-Atmosphere WUT A 6.09 4.35 6.59 .000 X12-Reasonable Prices 5.50 5.00 5.49 .000 N = 200 total 36 65 49 000 Note: Rankings are based on mean importance ratings of attributes. was a close second (mean = 6.42). Remington's was also rated the highest on atmosphere (mean = 6.59), but that factor was fifth most important. For speed of service (second most important) and competent employees (least important), Remington's was rated the lowest of the three competitors. JUN 13 29 A SPreview File Edit View Go Tools Window Help 6.28 GB $ 25% Tue 9:36 AM Q Joseph F., Jr. Hair, Mary F. Wolfinbarger, David J. Ortinau - Essentials of Marketing Research-McGraw-Hill (2016).pdf (page 331 of 433) Q Search 312 Part 4 Data Preparation, Analysis, and Reporting the Results Exhibit 11.24 Importance-Performance Chart for Remington's Steak House More Important Quadrant B Quadrant A X9-Food Quality X10-Speed of Service X12-Reasonable Prices 1 - - 7 Poor X7-Large Excellent Portions X11-Atmosphere X8-Competent Employees Quadrant C Quadrant D Less Important An easy way to convey the results of an image analysis is to prepare an impor- tance performance chart (IPC). To prepare this chart, calculate the mean values for the importance and performance questions for each of the restaurants. Then use these means to plot the position of each restaurant on a perceptual map. The IPC for Rem- ington's Steak House is shown in Exhibit 11.24. The chart shows that in terms of food quality and prices, Remington's is doing well. But there are several areas for improve- ment, particularly in comparison to the competition. The competitive restaurants can be plotted on a separate perceptual map. An IPC (perceptual map) has quadrants (A-D) that are described as follows: Quadrant A: Modifications are needed. Quadrant B: Good job-no need to modify. Quadrant C: Don't worry-low priority. Quadrant D: Rethink-a possible overkill. Hands-On Exercise 1. What are other areas of improvement for Remington's? 2. Run post-hoc ANOVA tests between the competitor groups. What additional problems or challenges did this reveal? 3. What new marketing strategies would you suggest? JUN 13 29
