

Question: Previous answer posted to this question is not helpful. Can this be reviewed in Python with the example taken into consideration, please? The nbaallelo_slr.csv dataset
Previous answer posted to this question is not helpful. Can this be reviewed in Python with the example taken into consideration, please? 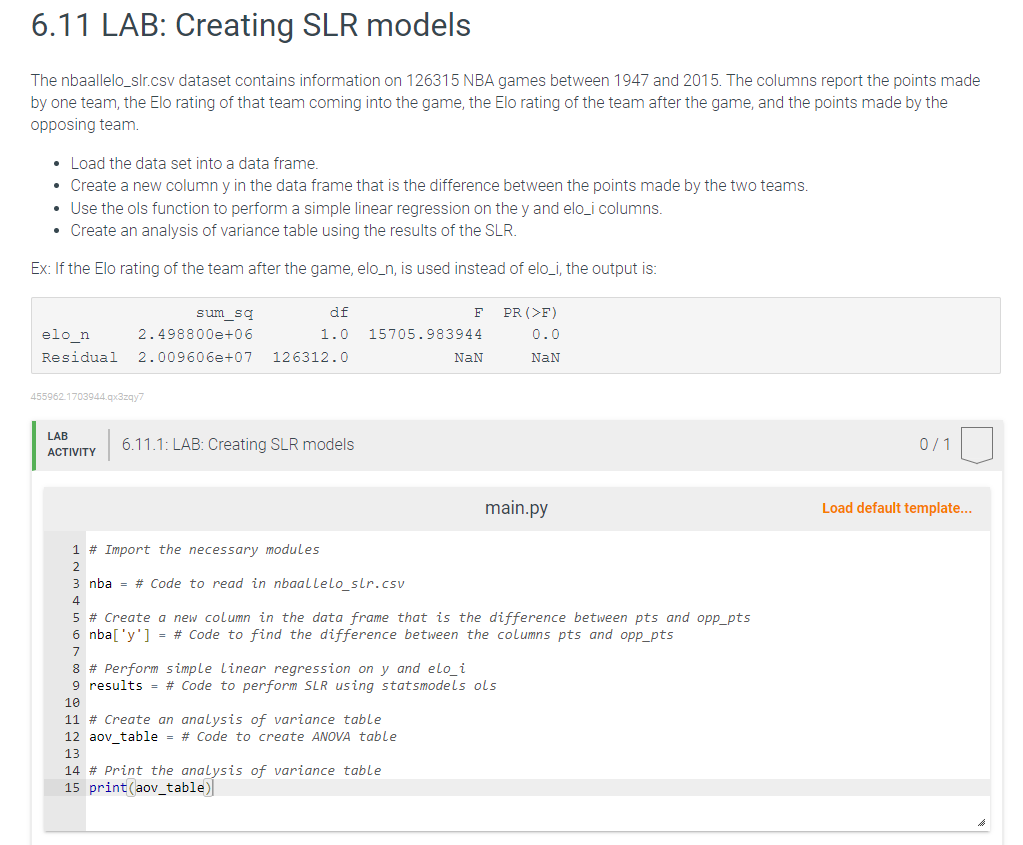
The nbaallelo_slr.csv dataset contains information on 126315 NBA games between 1947 and 2015. The columns report the points made by one team, the Elo rating of that team coming into the game, the Elo rating of the team after the game, and the points made by the opposing team. - Load the data set into a data frame. - Create a new column y in the data frame that is the difference between the points made by the two teams. - Use the ols function to perform a simple linear regression on the y and elo_i columns. - Create an analysis of variance table using the results of the SLR. Ex: If the Elo rating of the team after the game, elo_n, is used instead of elo_i, the output is: 455962.1703944.q3zqy7 0/1 Load default template
Step by Step Solution
There are 3 Steps involved in it

Get step-by-step solutions from verified subject matter experts