Answered step by step
Verified Expert Solution
Link Copied!

Question

1 Approved Answer

Price Demand 1/(Price) $0.45 5.034 2.222222222 $0.48 5.454 2.083333333 $0.50 7.146 2 $0.40 7.600 2.5 $0.47 4.897 2.127659574 $0.53 5.813 1.886792453 $0.56 5.851 1.785714286 $0.60
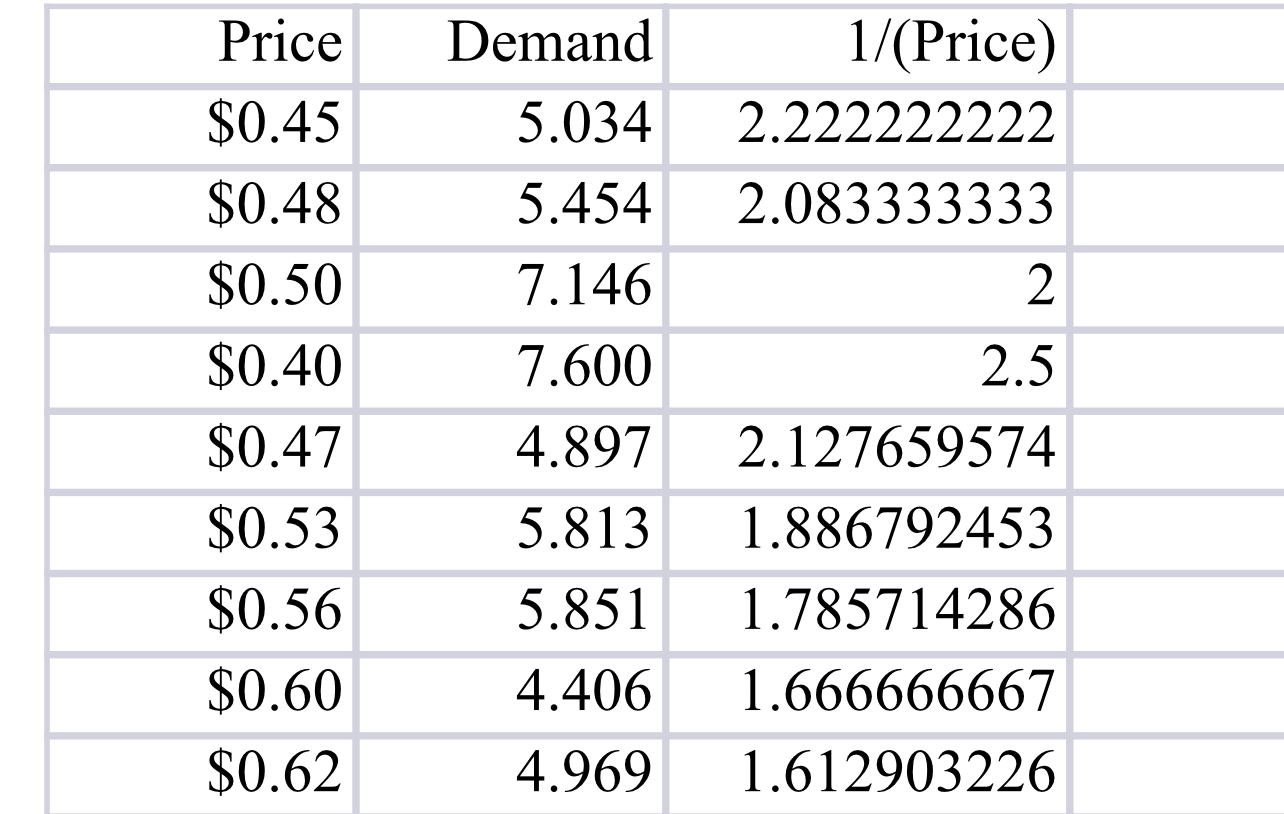
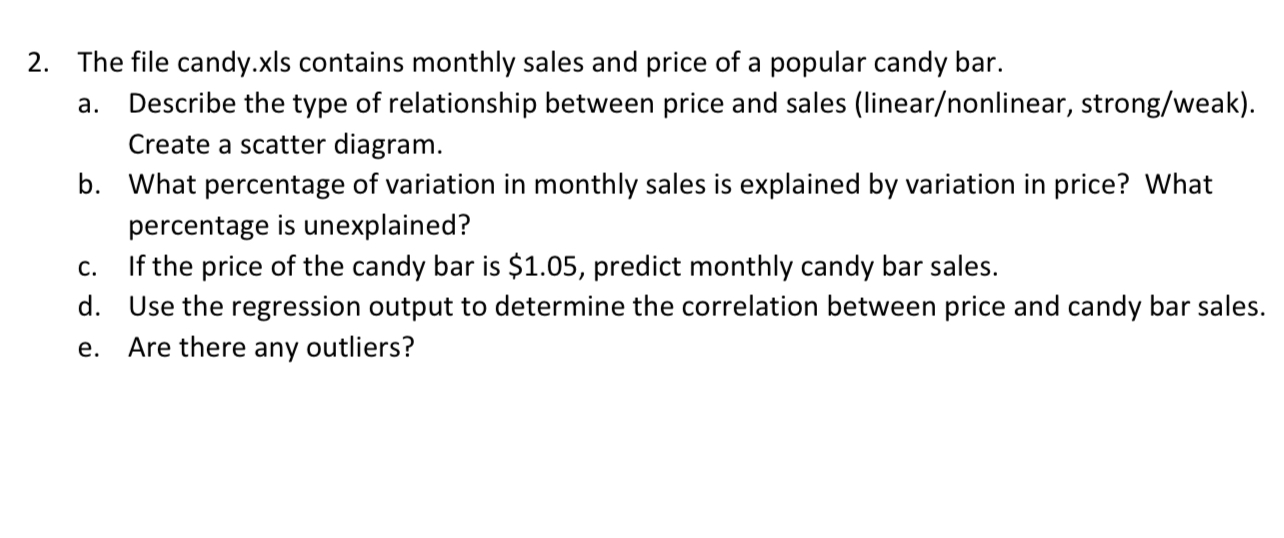
image text in transcribedimage text in transcribed
Price Demand 1/(Price) $0.45 5.034 2.222222222 $0.48 5.454 2.083333333 $0.50 7.146 2 $0.40 7.600 2.5 $0.47 4.897 2.127659574 $0.53 5.813 1.886792453 $0.56 5.851 1.785714286 $0.60 4.406 1.666666667 $0.62 4.969 1.6129032262. The file candy.xls contains monthly sales and price of a popular candy bar. a. Describe the type of relationship between price and sales (linearonlinear, strong/weak). Create a scatter diagram. b. What percentage of variation in monthly sales is explained by variation in price? What percentage is unexplained? c. If the price of the candy bar is $1.05, predict monthly candy bar sales. d. Use the regression output to determine the correlation between price and candy bar sales. e. Are there any outliers

Step by Step Solution

There are 3 Steps involved in it

Step: 1

blur-text-image

Get Instant Access to Expert-Tailored Solutions

See step-by-step solutions with expert insights and AI powered tools for academic success

Step: 2

blur-text-image_2

Step: 3

blur-text-image_3

Ace Your Homework with AI

Get the answers you need in no time with our AI-driven, step-by-step assistance

Get Started

Recommended Textbook for

Mathematics Concepts With Applications

Authors: Charles P McKeague

1st Edition

1630983136, 9781630983130

More Books

Students also viewed these Mathematics questions

Question

What type of community do I enjoy working in?

Answered: 1 week ago

Question

Discuss the key people management challenges that Dorian faced.

Answered: 1 week ago

Question

How fast should bidder managers move into the target?

Answered: 1 week ago