Price: suggested retail price of the used car in excellent condition. The condition of a car can greatly affect price. All cars in this data
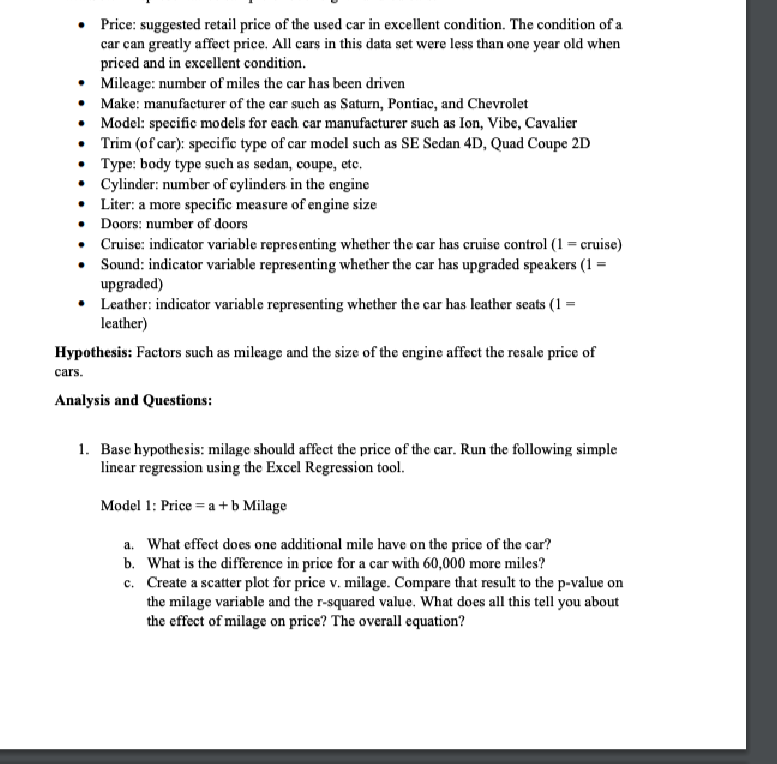
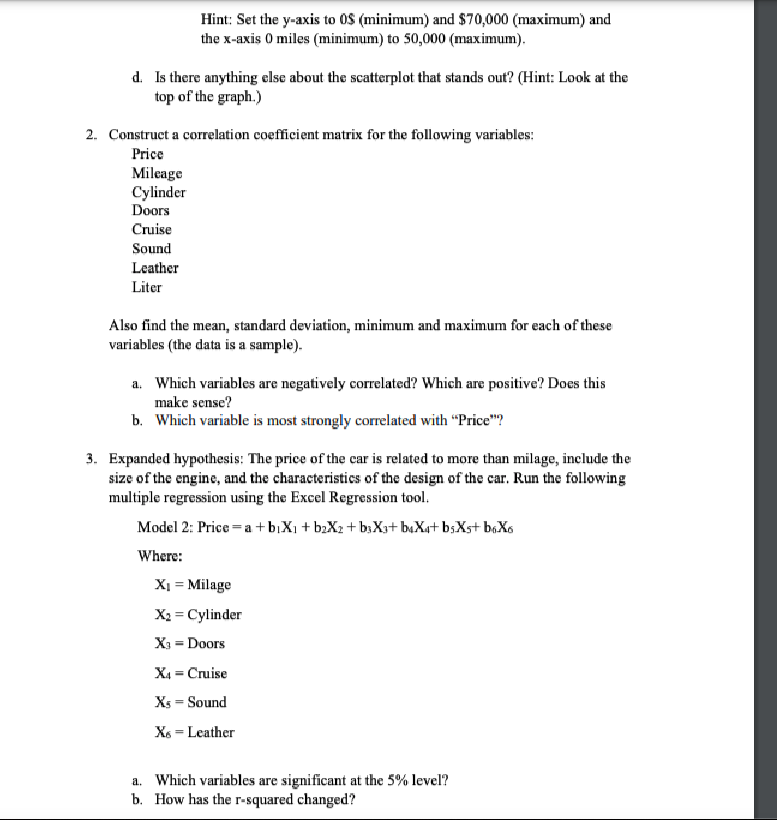
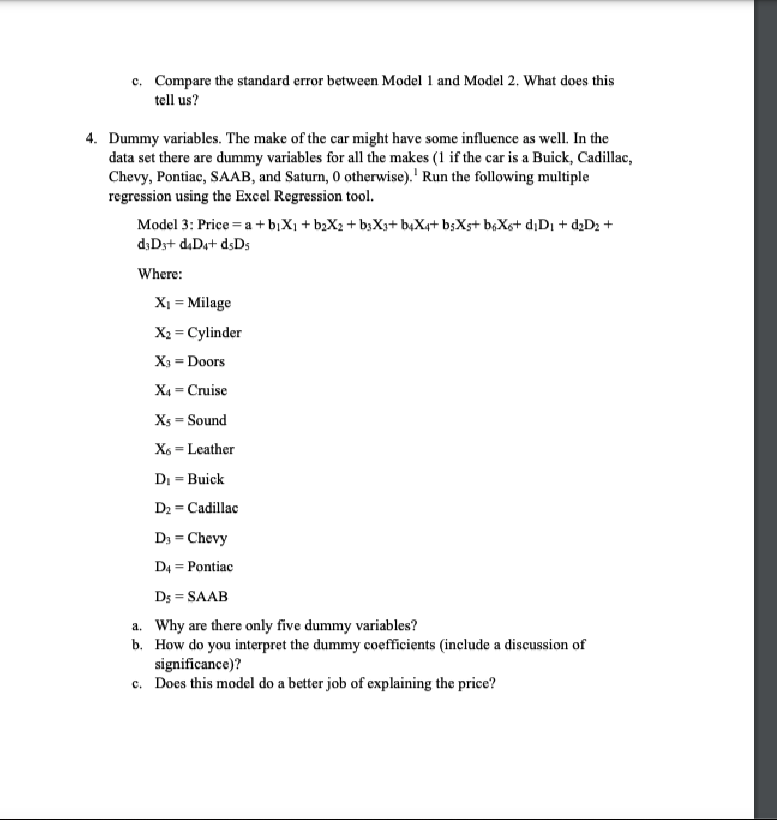
Price: suggested retail price of the used car in excellent condition. The condition of a car can greatly affect price. All cars in this data set were less than one year old when priced and in excellent condition. Mileage: number of miles the car has been driven Make: manufacturer of the car such as Saturn, Pontiac, and Chevrolet Model: specific models for each car manufacturer such as Ion, Vibe, Cavalier Trim (of car): specific type of car model such as SE Sedan 4D, Quad Coupe 2D Type: body type such as sedan, coupe, etc. Cylinder: number of cylinders in the engine Liter: a more specific measure of engine size Doors: number of doors Cruise: indicator variable representing whether the car has cruise control (1 = cruise) Sound: indicator variable representing whether the car has upgraded speakers (1 = upgraded) Leather: indicator variable representing whether the car has leather seats (1 = leather Hypothesis: Factors such as mileage and the size of the engine affect the resale price of cars Analysis and Questions: 1. Base hypothesis: milage should affect the price of the car. Run the following simple linear regression using the Excel Regression tool. Model 1: Price = a + b Milage a. What effect does one additional mile have on the price of the car? b. What is the difference in price for a car with 60,000 more miles? c. Create a scatter plot for price v. milage. Compare that result to the p-value on the milage variable and the r-squared value. What does all this tell you about the effect of milage on price? The overall equation?Hint: Set the y-axis to OS (minimum) and $70,000 (maximum) and the x-axis 0 miles (minimum) to 50,000 (maximum) d. Is there anything else about the scatterplot that stands out? (Hint: Look at the top of the graph.) 2. Construct a correlation coefficient matrix for the following variables: Price Mileage Cylinder Doors Cruise Sound Leather Liter Also find the mean, standard deviation, minimum and maximum for each of these variables (the data is a sample)- a. Which variables are negatively correlated? Which are positive? Does this make sense' b. Which variable is most strongly correlated with "Price"? 3. Expanded hypothesis: The price of the car is related to more than milage, include the size of the engine, and the characteristics of the design of the car. Run the following multiple regression using the Excel Regression tool. Model 2: Price = a + biX, + b2Xz + byX3+ buXat b;Xs+ boXs Where: X = Milage Xq = Cylinder X3 = Doors XA = Cruise Xs = Sound X6 = Leather a , Which variables are significant at the 5% level? b. How has the r-squared changed?. Compare the standard error between Model 1 and Model 2. What does this tell us? 4. Dummy variables. The make of the car might have some influence as well. In the data set there are dummy variables for all the makes (1 if the car is a Buick, Cadillac, Chevy, Pontiac, SAAB, and Saturn, 0 otherwise).' Run the following multiple regression using the Excel Regression tool. Model 3: Price=a + biX, + bzX2 + byXg+ byX,+ b;Xs+ b;Xs+ diDi + diDy + d;Dy+ d.Dat dsDs Where: X1 = Milage Xa = Cylinder X3 = Doors Xa = Cruise Xs = Sound X6 = Leather DI = Buick D2 = Cadillac Dj = Chevy D4 = Pontiac D; = SAAB a. Why are there only five dummy variables? b. How do you interpret the dummy coefficients (include a discussion of significance)? Does this model do a better job of explaining the price?. Compare the standard error between Model 1 and Model 2. What does this tell us? 4. Dummy variables. The make of the car might have some influence as well. In the data set there are dummy variables for all the makes (1 if the car is a Buick, Cadillac, Chevy, Pontiac, SAAB, and Saturn, 0 otherwise).' Run the following multiple regression using the Excel Regression tool. Model 3: Price=a + biX, + bzX2 + byXg+ byX,+ b;Xs+ b;Xs+ diDi + diDy + d;Dy+ d.Dat dsDs Where: X1 = Milage Xa = Cylinder X3 = Doors Xa = Cruise Xs = Sound X6 = Leather DI = Buick D2 = Cadillac Dj = Chevy D4 = Pontiac D; = SAAB a. Why are there only five dummy variables? b. How do you interpret the dummy coefficients (include a discussion of significance)? Does this model do a better job of explaining the price?Question 11 Excel Exercise. Using the results for Model 1, for a car with 30,000 more miles, what happens to the price? O The price increases by about $5000 O The price decreases by about $5000 O The price increases by about $25,000 O The price does not change Question 12 Excel Exercise. Which variable has the strongest negative correlation with price? O Milage O Cylinder Doors O CruiseQuestion 13 Excel Exercise. Which statement best interprets a p-value? O This is the probability that the lower bound of the hypothesis test will be found from the sample data. O This is the probability that, given the null hypothesis is true, one would find a test statistic of this size. O This is the probability that, given the null hypothesis is true, one would find a test statistic at least 10 percent larger than this number. O This is the probability that one would find this test statistic in the t-table at the back of the book. Question 14 Excel Exercise. How many observations are in this data set? O 803 O 805 O 800 O 804Question 15 Excel Exercise. Using the results for Model 2, what is the F- statistic? (Round to 2 decimals.) O 1.23 O 95.40 O 106.80 O 7323.16Question 17 Excel Exercise. Using the results for Model 3, what is the coefficient of (multiple) determination (round to 4 decimals) O 0.9288 O 0.8627 O 0.8608 O Cannot tell Question 18 Excel Exercise. Using the results for Model 2, how should we interpret the coefficient on Cylinder? O Larger engine size decreases the price. O Larger engine size increases the price. O Larger engine size increases the size of the car. O Cannot tell from the sign of the coefficient.Excel Exercise. Using the results for Model 3, what is the coefficient of (multiple) determination (round to 4 decimals) O 0.9288 O 0.8627 O 0.8608 O Cannot tell
Step by Step Solution
There are 3 Steps involved in it
Step: 1
Get Instant Access to Expert-Tailored Solutions
See step-by-step solutions with expert insights and AI powered tools for academic success
Step: 2
Step: 3
Ace Your Homework with AI
Get the answers you need in no time with our AI-driven, step-by-step assistance