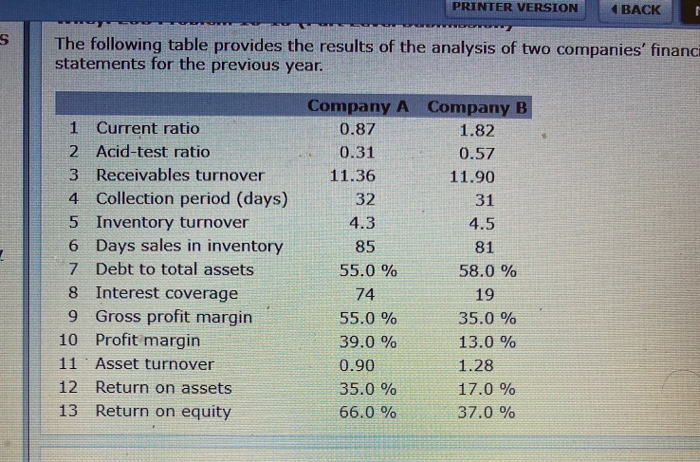
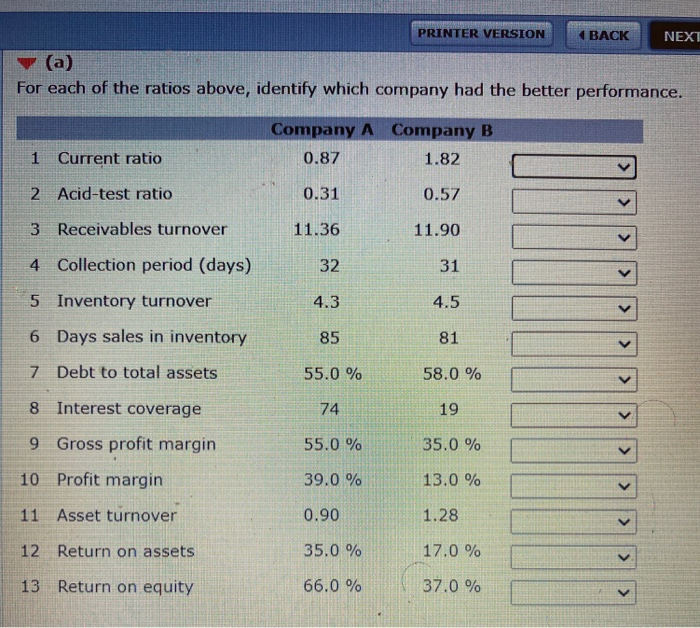
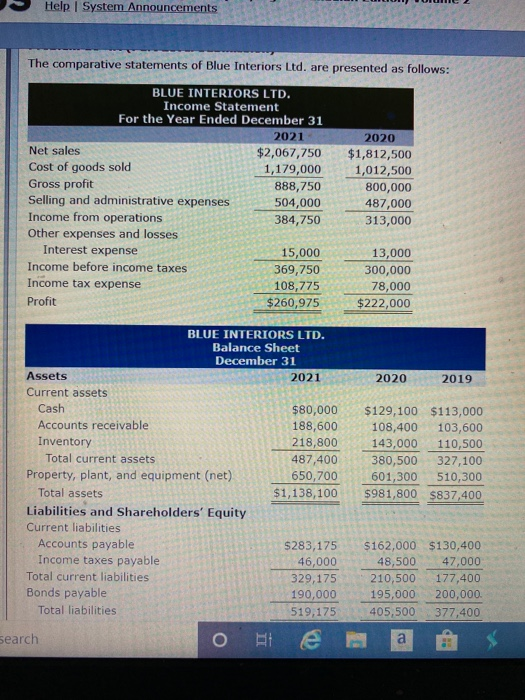
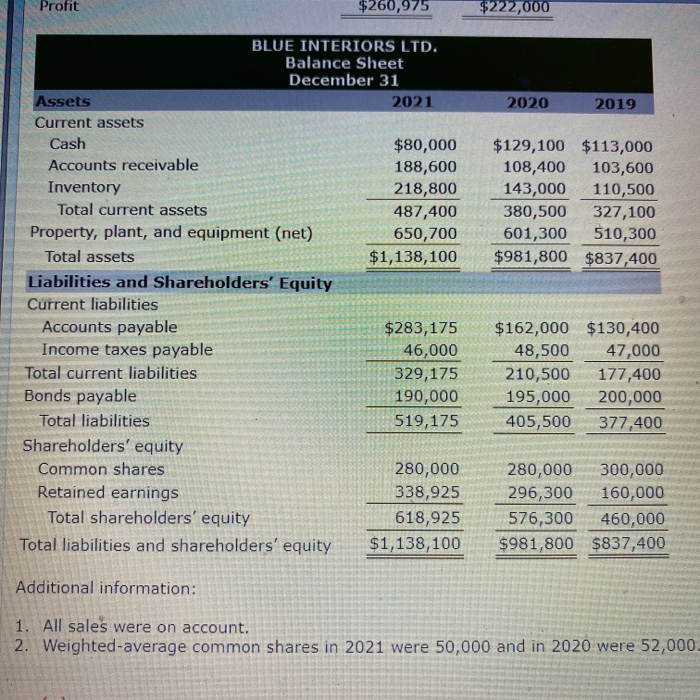
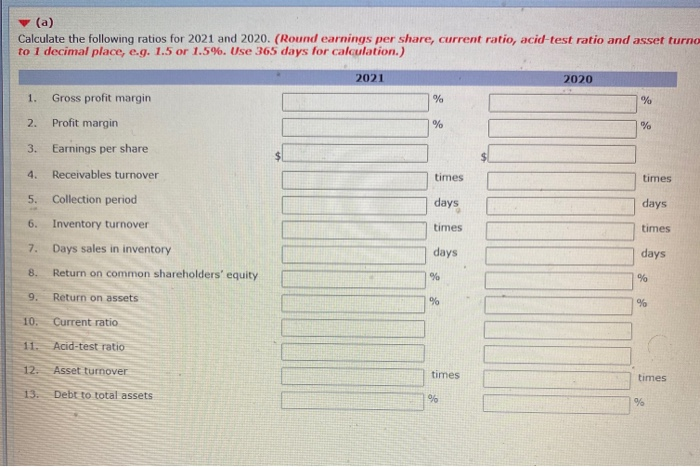
PRINTER VERSION BACK s The following table provides the results of the analysis of two companies' financi statements for the previous year. 1 Current ratio 2 Acid-test ratio 3 Receivables turnover 4 Collection period (days) 5 Inventory turnover 6 Days sales in inventory 7 Debt to total assets 8 Interest coverage 9 Gross profit margin 10 Profit margin 11 . Asset turnover 12 Return on assets 13 Return on equity Company A Company B 0.87 1.82 0.31 0.57 11.36 11.90 32 31 4.3 4.5 85 81 55.0 % 58.0 % 74 55.0 % 35.0 % 39.0 % 13.0 % 0.90 1.28 35.0 % 17.0 % 66.0 % 37.0 % 19 PRINTER VERSION BACK NEXT (a ) For each of the ratios above, identify which company had the better performance. Company A Company B 0.87 1.82 1 Current ratio 2 Acid-test ratio 0.31 0.57 3 Receivables turnover 11.36 11.90 > 4 Collection period (days) 32 31 5 Inventory turnover 4.3 4.5 6 Days sales in inventory 85 81 7 Debt to total assets 55.0 % 58.0 % 8 Interest coverage 74 19 > 9 Gross profit margin 55.0 % 35.0 % 10 Profit margin 39.0 % 13.0 % 11 Asset turnover 0.90 1.28 > 12 Return on assets 35.0 % 17.0 % 13 Return on equity 66.0 % 37.0 % > Help System Announcements The comparative statements of Blue Interiors Ltd. are presented as follows: BLUE INTERIORS LTD. Income Statement For the Year Ended December 31 2021 Net sales $2,067,750 Cost of goods sold 1,179,000 Gross profit 888,750 Selling and administrative expenses 504,000 Income from operations 384,750 Other expenses and losses Interest expense 15,000 Income before income taxes 369,750 Income tax expense 108,775 Profit $260,975 2020 $1,812,500 1,012,500 800,000 487,000 313,000 13,000 300,000 78,000 $222,000 2020 2019 BLUE INTERIORS LTD. Balance Sheet December 31 Assets 2021 Current assets Cash $80,000 Accounts receivable 188,600 Inventory 218,800 Total current assets 487,400 Property, plant, and equipment (net) 650,700 Total assets $1,138,100 Liabilities and Shareholders' Equity Current liabilities Accounts payable $283,175 Income taxes payable 46,000 Total current liabilities 329,175 Bonds payable 190,000 Total liabilities 519,175 $129,100 $113,000 108,400 103,600 143,000 110,500 380,500 327,100 601,300 510,300 $981,800 $837,400 $162,000 $130,400 48,500 47,000 210,500 177,400 195,000 200,000 405,500 377,400 search a Profit $260,975 $222,000 2020 2019 $129,100 $113,000 108,400 103,600 143,000 110,500 380,500 327,100 601,300 510,300 $981,800 $837,400 BLUE INTERIORS LTD. Balance Sheet December 31 Assets 2021 Current assets Cash $80,000 Accounts receivable 188,600 Inventory 218,800 Total current assets 487,400 Property, plant, and equipment (net) 650,700 Total assets $1,138,100 Liabilities and Shareholders' Equity Current liabilities Accounts payable $283,175 Income taxes payable 46,000 Total current liabilities 329,175 Bonds payable 190,000 Total liabilities 519,175 Shareholders' equity Common shares 280,000 Retained earnings 338,925 Total shareholders' equity 618,925 Total liabilities and shareholders' equity $1,138,100 $162,000 $130,400 48,500 47,000 210,500 177,400 195,000 200,000 405,500 377,400 280,000 300,000 296,300 160,000 576,300 460,000 $981,800 $837,400 Additional information: 1. All sales were on account. 2. Weighted average common shares in 2021 were 50,000 and in 2020 were 52,000 (a) Calculate the following ratios for 2021 and 2020. (Round earnings per share, current ratio, acid-test ratio and asset turno to 1 decimal place, e.g. 1.5 or 1.5%. Use 365 days for calculation.) 2021 2020 % % 1. Gross profit margin 2. Profit margin 3. Earnings per share % % 4. Receivables turnover times times 5. Collection period days days 6. Inventory turnover times times 7. days days 8. % % 9. Days sales in inventory Return on common shareholders' equity Return on assets Current ratio Acid-test ratio % % 10. 11. 12 Asset turnover times times 13. Debt to total assets % 9
