Question
Problem 07 In the previous homework assignments, you have calculated the standard error on the mean as a function of the sample size. Rather than
Problem 07
In the previous homework assignments, you have calculated the standard error on the mean as a function of the sample size. Rather than repeating that process again, let's use Pandas to help visualize what's happening when we generate the random samples. Pandas has built-in plotting methods that make it quite simple to generate useful statistical graphics to help us understand a data set. We will discuss visualization in more detail later in the course.
The matplotlib.pyplot module is imported for you below.
In[]:
import matplotlib.pyplot as plt
Over the last few weeks we have talked about the difference between replications associated with simulations and the sample size effect we wish to study. We estimated the standard error on the mean by generating 5000 replications of the sample average. As we saw in Week 02, we used 5000 replications because the distribution on the sample average converges to a Gaussian (a bell curve) in the limit of an infinite number of replications. Replicating thousands of times allows our simulated results to match the theoretical results.
This week, you will work with a smaller number of replications. The simulated estimate to the standard error no longer matches the theoretical result with so few replications. However, it will be easier to visualize the random samples and summary statistics with so few replications. You will specifically use 100 replications for this problem.
7a)
You must use the same format of the last assignment where we stored the samples down rows and the replications along the columns of a NumPy 2D array. Use NumPy to generate 5 samples of a Normal (Gaussian or bell curve) with mean 100 and standard deviation 25 and replicate that process 100 times. Do NOT calculate summary statistics associated with these samples.
Assign the result to the variable X005.
IMPORTANT: Do NOT forget to set the random seed!!!!
7a) - SOLUTION
In[1]:
import numpy as np?np.random.seed(0) # set the random seedX005 = np.random.normal(loc=100, scale=25, size=(5, 100))
In[]:
?
7b)
Convert the X005 NumPy array to a Pandas DataFrame and assign the result to the df005 object. You may use the default index and columnsarguments when you create the DataFrame.
Use the appropriate attribute to display the number of rows and columns associated with df005 to the screen.
7b) - SOLUTION
In[2]:
import pandas as pd?df05 = pd.DataFrame(X005)print('Number of rows:', df05.shape[0])print('Number of columns:', df05.shape[1])
Number of rows: 5Number of columns: 100
In[]:
?
7c)
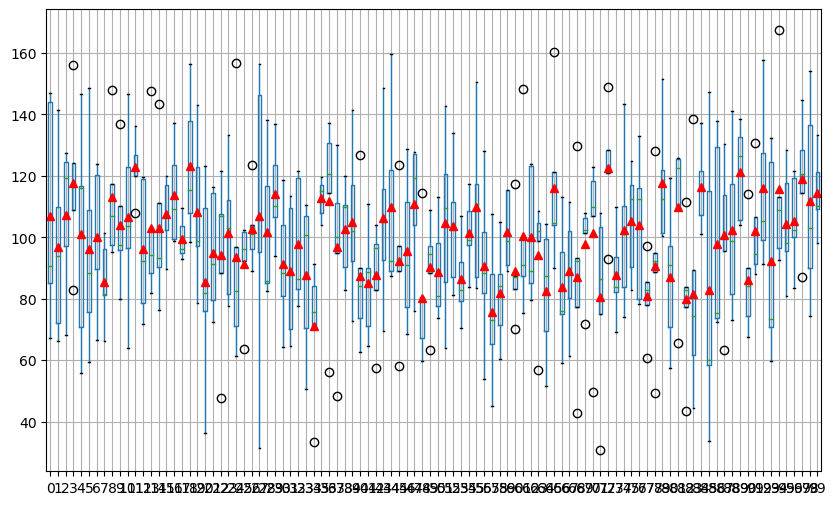
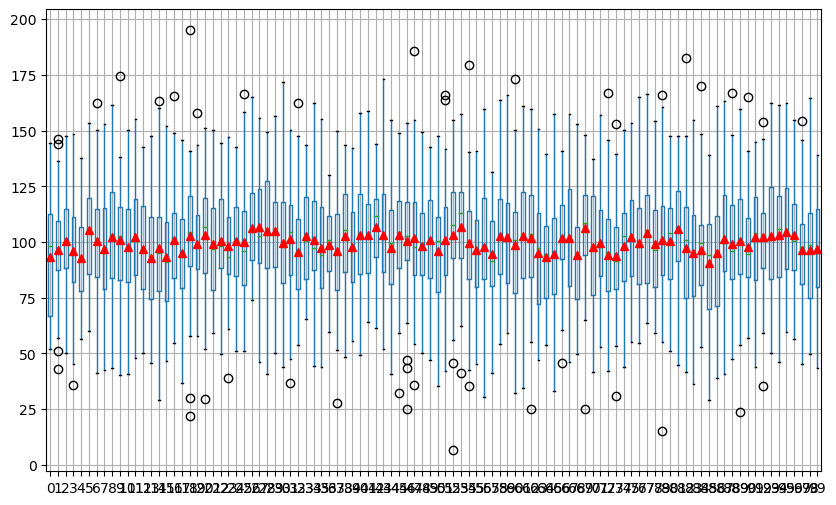
Let's visualize the summary statistics associated with the 5 random samples over the 100 replications with a boxplot. Again, you will learn about the boxplot in more detail later. For now, you will focus on the SPREAD or VARIATION through the HEIGHT of the box and whiskers (the vertical lines coming from the box) and on the CENTRAL behavior through the MEAN. Therefore, you must set the appropriate arguments to display the MEAN within the boxplot. The MEAN must be displayed as red triangles.
Use the appropriate method to summarize the replications of the 5 random samples as a boxplot.
7c) - SOLUTION
In[3]:
import matplotlib.pyplot as plt?plt.figure(figsize=(10, 6))df05.boxplot(showmeans=True, meanprops={"marker":"^","markerfacecolor":"red", "markeredgecolor":"red"})plt.show()


Step by Step Solution
There are 3 Steps involved in it
Step: 1

Get Instant Access to Expert-Tailored Solutions
See step-by-step solutions with expert insights and AI powered tools for academic success
Step: 2

Step: 3

Ace Your Homework with AI
Get the answers you need in no time with our AI-driven, step-by-step assistance
Get Started


