

Question
Problem 1: Plot Prices. Write a program Prices.java that reads, prints, and plots stock prices. Your program must handle all inputs that conform to the
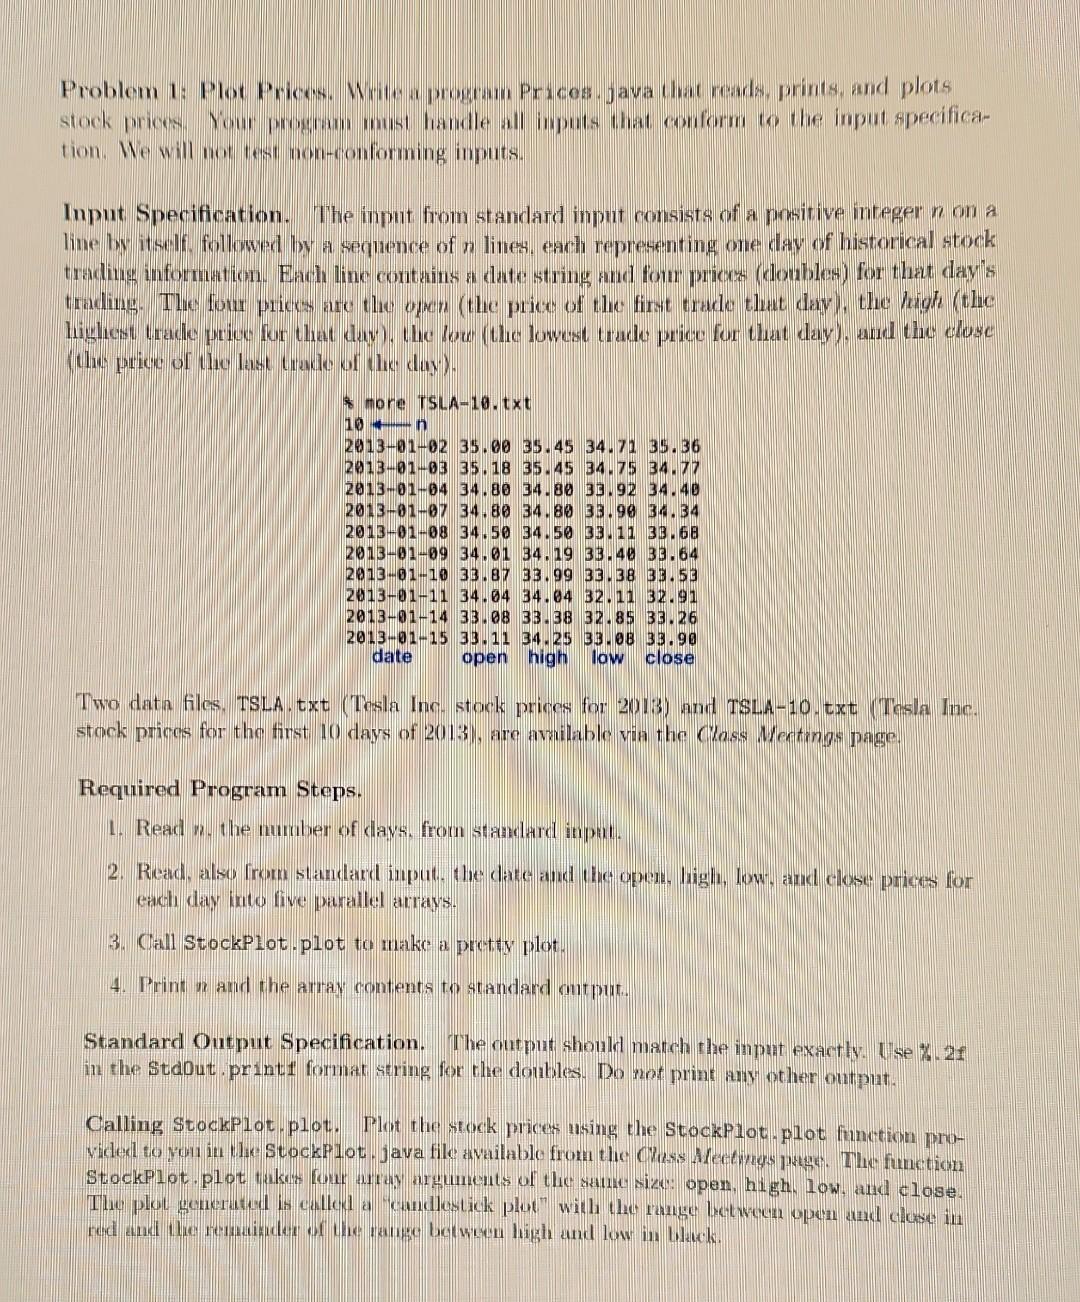
Problem 1: Plot Prices. Write a program Prices.java that reads, prints, and plots stock prices. Your program must handle all inputs that conform to the input specification. We will not test non-conforming inputs. Input Specification. The input from standard input consists of a positive integer n on a line by itself, followed by a sequence of n lines, each representing one day of historical stock trading information. Each line contains a date string and four prices (doubles) for that days trading. The four prices are the open (the price of the first trade that day), the high (the highest trade price for that day), the low (the lowest trade price for that day), and the close (the price of the last trade of the day). Two data files, TSLA.txt (Tesla Inc. stock prices for 2013) and TSLA-10.txt (Tesla Inc. stock prices for the first 10 days of 2013), are available via the Class Meetings page. Required Program Steps. 1. Read n, the number of days, from standard input. 2. Read, also from standard input, the date and the open, high, low, and close prices for each day into five parallel arrays. 3. Call StockPlot.plot to make a pretty plot. 4. Print n and the array contents to standard output. Standard Output Specification. The output should match the input exactly. Use %.2f in the StdOut.printf format string for the doubles. Do not print any other output. Calling StockPlot.plot. Plot the stock prices using the StockPlot.plot function provided to you in the StockPlot.java file available from the Class Meetings page. The function StockPlot.plot takes four array arguments of the same size: open, high, low, and close. The plot generated is called a candlestick plot with the range between open and close in red and the remainder of the range between high and low in black.
Problem 1: Plot Prices. Mrite a program Prxces. jaya that rearks, prints, and plots stock prices. Your program mest handle all inputs that conform to the input specification. We will not test non-conforming inputs. Input Specification. The input from standard input consists of a positive integer n on a line by itself. followed by a sequence of n lines, each representing one day of historical stock trading information. Each line conterins a date string and fom pricos (doubles) for that day's trading. The four prices are the open (the price of the first trade that day), the high (the highest trade priee for that day). the low (the lowest trade price for that day), and the close (the price of the last trade of the day). Two data files, TSLA. txt (Tesla Inr. stock prices for 2013) and TSLA-10. txt (Tesla Ine. stock prices for the first 10 days of 2013], are available via the Closs Mentings page. Required Program Steps. 1. Read n. the number of clays, frotn standard inpat. 2. Read, also from standard input. the date and the open, high, low, and close prices for each day into five parallel arrays. 3. Call StockPlot. plot to make a pretty plot. 4. Print n and the array contents to standard ontpur. Standard Output Specification. The output should match the input exactly. Use y. 2f in the Stadut. printi format string for the doubles. Do not print aay other output. Calling StockPlot. plot. Plot the stock prices using the StockPlot, plot function provided to yon in the StockP lot. java file available from the Cless Aectings prges. The function StockPlot. plot, taker four array arguments of the sause size: open, high. low, and close. The plot generated is called a candlestick plot, with the ramge between open and close in red and the remainder of the range between high and low in bleckStep by Step Solution
There are 3 Steps involved in it
Step: 1

Get Instant Access to Expert-Tailored Solutions
See step-by-step solutions with expert insights and AI powered tools for academic success
Step: 2

Step: 3
Ace Your Homework with AI
Get the answers you need in no time with our AI-driven, step-by-step assistance
Get Started
Building The Data Lakehouse
Authors: Bill Inmon ,Mary Levins ,Ranjeet Srivastava
1st Edition
1634629663, 978-1634629669