

Question
Problem 1 - Student Loans (Please use python to solve this problem) Input files: Download debt_vs_tuition.txt, and save it in the same directory as your
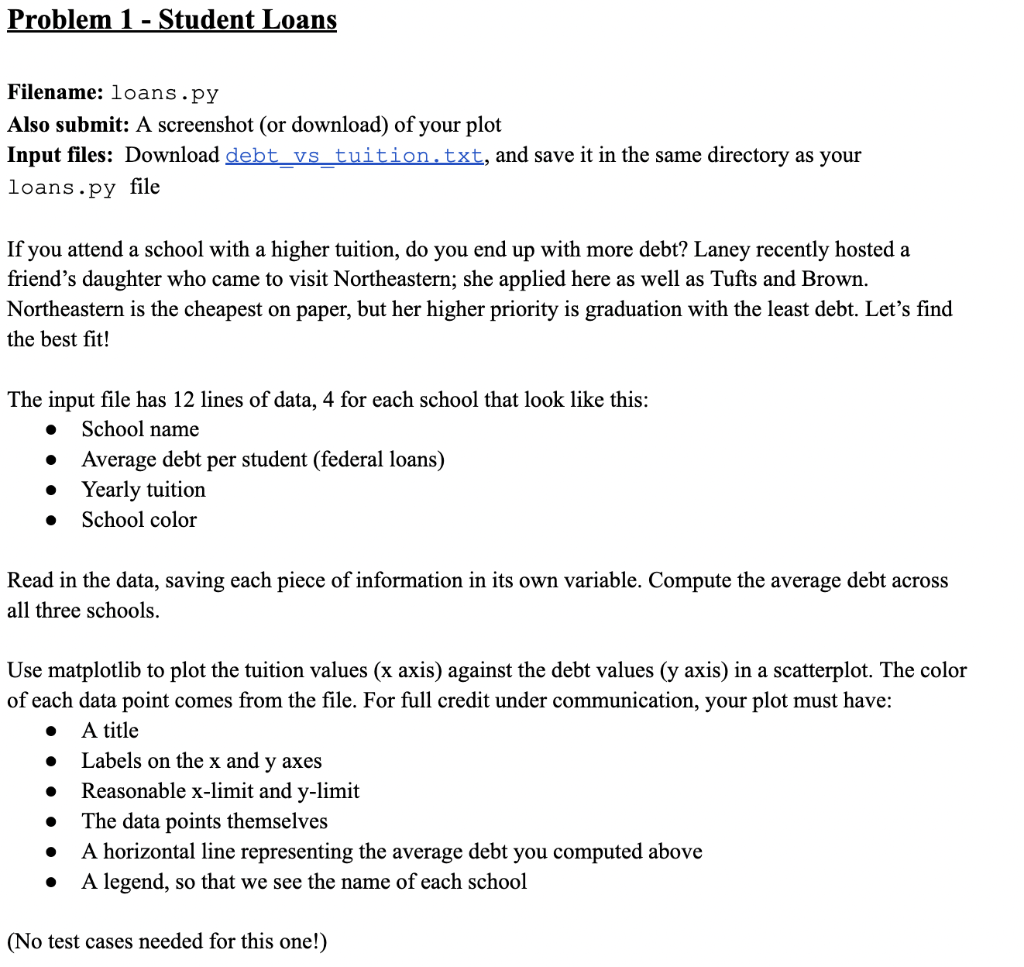
Problem 1 - Student Loans (Please use python to solve this problem)
Input files: Download debt_vs_tuition.txt, and save it in the same directory as your loans.py file
Also submit: A screenshot (or download) of your plot
If you attend a school with a higher tuition, do you end up with more debt?
Laney recently hosted a friends daughter who came to visit Northeastern;
She applied here as well as Tufts and Brown. Northeastern is the cheapest on paper,
But her higher priority is graduation with the least debt.
Lets find the best fit!
The input file has 12 lines of data, 4 for each school that look like this:
1. School name
2. Average debt per student (federal loans)
3. Yearly tuition
4. School color
Read in the data, saving each piece of information in its own variable.
Compute the average debt across all three schools.
Use matplotlib to plot the tuition values (x axis) against the debt values (y axis) in a scatterplot.
The color of each data point comes from the file. For full credit under communication.
Your plot must have:
1. A title
2. Labels on the x and y axes
3. Reasonable x-limit and y-limit
4. The data points themselves
5. A horizontal line representing the average debt you computed above
6. A legend, so that we see the name of each school
Please follow the rubrics below:
Gather data
Open the file and read in school name (string), average debt (int), tuition (int), and color (string) for each school
Save every line of the file as a variable
Computations
Compute average debt over the 3 relevant data points
Communicate
Use matplotlib to create a plot as described
Scatterplot with debt on y axis, tuition on x axis
Plot also has a horizontal line for average debt
Plot has labels, title, legend, and correct colors (from the file)
Readability
File name is saved in a constant above main
Step by Step Solution
There are 3 Steps involved in it
Step: 1

Get Instant Access to Expert-Tailored Solutions
See step-by-step solutions with expert insights and AI powered tools for academic success
Step: 2

Step: 3
Ace Your Homework with AI
Get the answers you need in no time with our AI-driven, step-by-step assistance
Get Started
Objects And Databases International Symposium Sophia Antipolis France June 13 2000 Revised Papers Lncs 1944
Authors: Klaus R. Dittrich ,Giovanna Guerrini ,Isabella Merlo ,Marta Oliva ,M. Elena Rodriguez
2001st Edition
3540416641, 978-3540416647