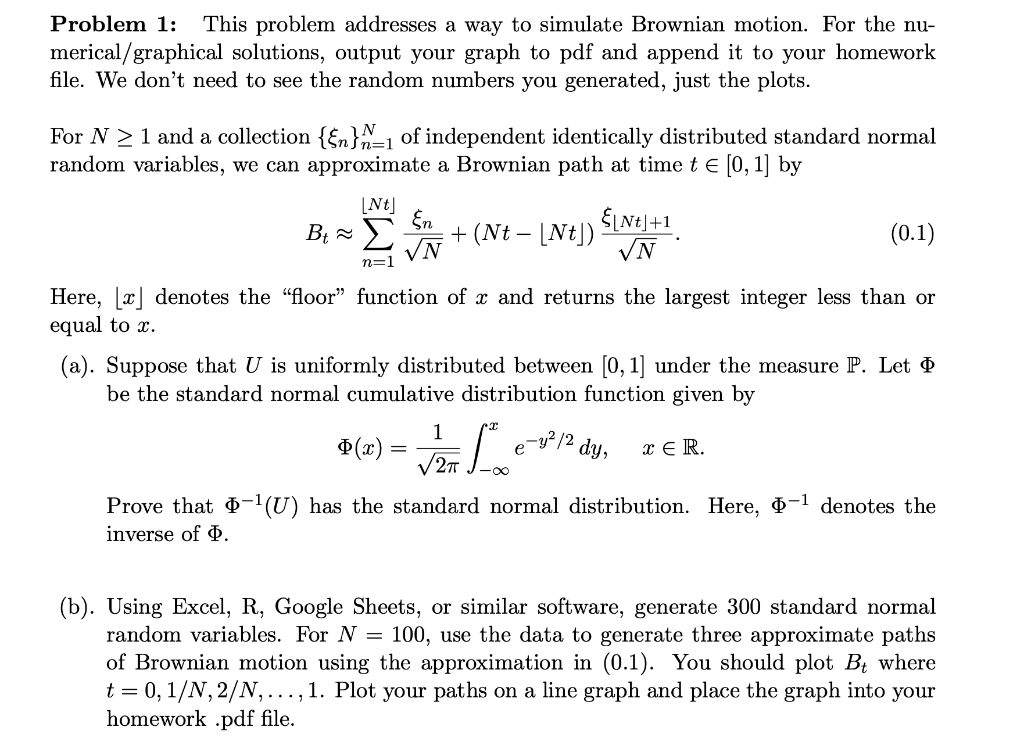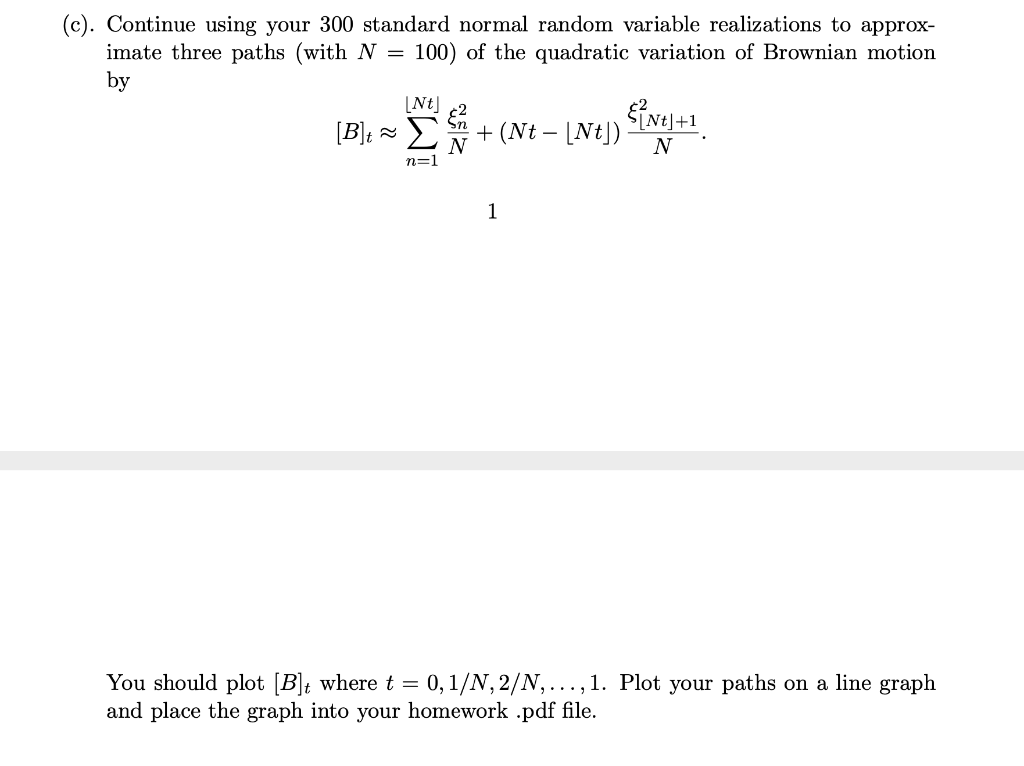

Problem 1: This problem addresses a way to simulate Brownian motion. For the nu- merical/graphical solutions, output your graph to pdf and append it to your homework file. We don't need to see the random numbers you generated, just the plots. For N > 1 and a collection {En}N=1 of independent identically distributed standard normal random variables, we can approximate a Brownian path at time te [0, 1] by Nt ${Nt]+1 Bta +(Nt - [Nt]) (0.1) VN VN n=1 Here, [] denotes the floor function of x and returns the largest integer less than or equal to x. (a). Suppose that U is uniformly distributed between [0, 1] under the measure P. Let 0 be the standard normal cumulative distribution function given by 1 0 . 2 Prove that 0-1(U) has the standard normal distribution. Here, 0-1 denotes the inverse of 0. 3(x) = Van Lier/?dy, DER (b). Using Excel, R, Google Sheets, or similar software, generate 300 standard normal random variables. For N = 100, use the data to generate three approximate paths of Brownian motion using the approximation in (0.1). You should plot Bwhere t= 0, 1/N, 2/N,.. 1. Plot your paths on a line graph and place the graph into your homework .pdf file. = (c). Continue using your 300 standard normal random variable realizations to approx- imate three paths (with N = 100) of the quadratic variation of Brownian motion by Nt [B]ta +(Nt [Nt]) N & Nt] +1 WI 1 You should plot [B]t where t = 0,1/N, 2/N,...,1. Plot your paths on a line graph and place the graph into your homework .pdf file. Problem 1: This problem addresses a way to simulate Brownian motion. For the nu- merical/graphical solutions, output your graph to pdf and append it to your homework file. We don't need to see the random numbers you generated, just the plots. For N > 1 and a collection {En}N=1 of independent identically distributed standard normal random variables, we can approximate a Brownian path at time te [0, 1] by Nt ${Nt]+1 Bta +(Nt - [Nt]) (0.1) VN VN n=1 Here, [] denotes the floor function of x and returns the largest integer less than or equal to x. (a). Suppose that U is uniformly distributed between [0, 1] under the measure P. Let 0 be the standard normal cumulative distribution function given by 1 0 . 2 Prove that 0-1(U) has the standard normal distribution. Here, 0-1 denotes the inverse of 0. 3(x) = Van Lier/?dy, DER (b). Using Excel, R, Google Sheets, or similar software, generate 300 standard normal random variables. For N = 100, use the data to generate three approximate paths of Brownian motion using the approximation in (0.1). You should plot Bwhere t= 0, 1/N, 2/N,.. 1. Plot your paths on a line graph and place the graph into your homework .pdf file. = (c). Continue using your 300 standard normal random variable realizations to approx- imate three paths (with N = 100) of the quadratic variation of Brownian motion by Nt [B]ta +(Nt [Nt]) N & Nt] +1 WI 1 You should plot [B]t where t = 0,1/N, 2/N,...,1. Plot your paths on a line graph and place the graph into your homework .pdf file


