Question
Problem 1 - Votes for Women (Please use Python to solve the following problem) You can use the link below to pull out the .csv
Problem 1 - Votes for Women (Please use Python to solve the following problem)
You can use the link below to pull out the .csv doc!
https://course.ccs.neu.edu/ds2000/homework/hw4/1920_women_voters.csv
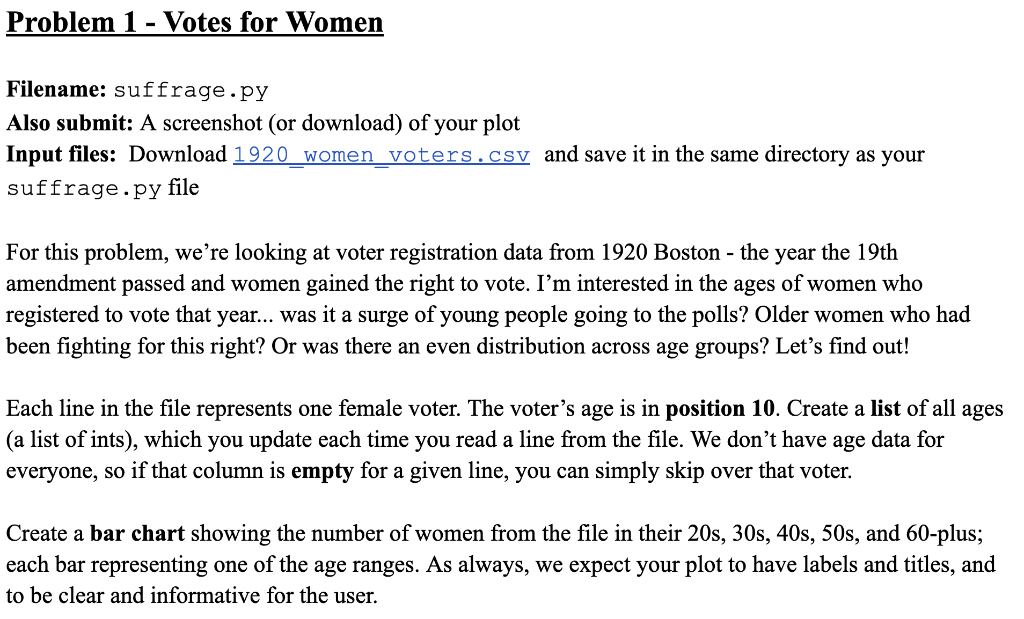
For this problem, were looking at voter registration data from 1920 Boston
The year the 19th amendment passed and women gained the right to vote.
Im interested in the ages of women who registered to vote that year...
Was it a surge of young people going to the polls?
Older women who had been fighting for this right?
Or was there an even distribution across age groups?
Lets find out!
Each line in the file represents one female voter.
The voters age is in position 10. Create a list of all ages (a list of ints)
Which you update each time you read a line from the file.
We dont have age data for everyone, so if that column is empty for a given line.
You can simply skip over that voter.
Create a bar chart showing the number of women from the file in their:
20s, 30s, 40s, 50s, and 60-plus; each bar representing one of the age ranges.
As always, we expect your plot to have labels and titles,
Also to be clear and informative for the user.
Please follow all the rubrics below:
Gather data
Open the file and read in the data voter by voter
Check that an age exists in each line; if not, skip over it
Append the current voters age as an int to a list
Computations
Count the number of women in their 20s, 30s, 40s, 50, and 60+
Communication
Use matplotlib to create a plot as described
Bar plot with one bar per age group
Label each bar with the correct age range
Plot has title and y-label
Readability
File name is saved in a constant above main
Position 10 for the age is saved in a constant above main
Code inside with/open/as structure is needed for file processing
Variable i is used for position, not value

Step by Step Solution
There are 3 Steps involved in it
Step: 1

Get Instant Access to Expert-Tailored Solutions
See step-by-step solutions with expert insights and AI powered tools for academic success
Step: 2

Step: 3

Ace Your Homework with AI
Get the answers you need in no time with our AI-driven, step-by-step assistance
Get Started


