Answered step by step
Verified Expert Solution
Link Copied!

Question

1 Approved Answer

Problem 1. You have access to the following three stocks: Asset Stock A Stock B Stock C Expected Return Standard Deviation 10% 20% 15% 40%
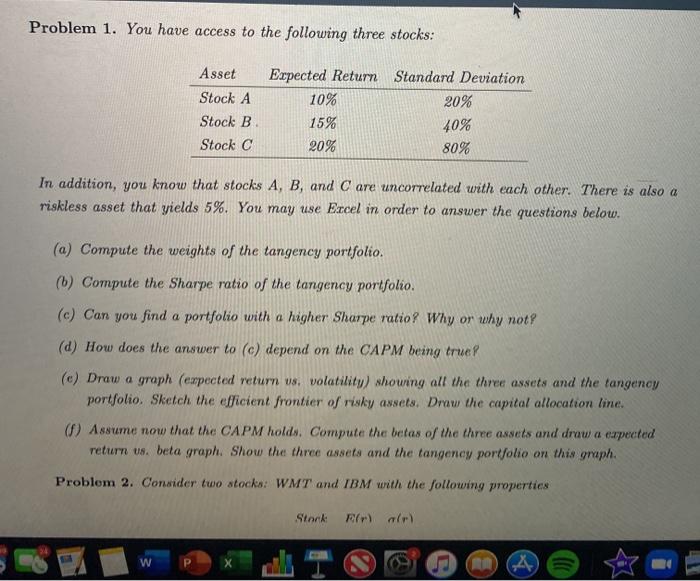
image text in transcribed
Problem 1. You have access to the following three stocks: Asset Stock A Stock B Stock C Expected Return Standard Deviation 10% 20% 15% 40% 20% 80% In addition, you know that stocks A, B, and C are uncorrelated with each other. There is also a riskless asset that yields 5%. You may use Excel in order to answer the questions below. (a) Compute the weights of the tangency portfolio. (b) Compute the Sharpe ratio of the tangency portfolio. (c) Can you find a portfolio with a higher Sharpe ratio? Why or why not? (d) How does the answer to (c) depend on the CAPM being true (e) Draw a graph (expected return us volatility) shouring all the three assets and the tangency portfolio. Sketch the efficient frontier of risky assets. Draw the capital allocation line. Assume now that the CAPM holds. Compute the betas of the three assets and draw a expected return us. beta graph. Show the three assets and the tangency portfolio on this graph. Problem 2. Consider two stocks: WMT and IBM with the following properties Stark Rr) ar Problem 1. You have access to the following three stocks: Asset Stock A Stock B Stock C Expected Return Standard Deviation 10% 20% 15% 40% 20% 80% In addition, you know that stocks A, B, and C are uncorrelated with each other. There is also a riskless asset that yields 5%. You may use Excel in order to answer the questions below. (a) Compute the weights of the tangency portfolio. (b) Compute the Sharpe ratio of the tangency portfolio. (c) Can you find a portfolio with a higher Sharpe ratio? Why or why not? (d) How does the answer to (c) depend on the CAPM being true (e) Draw a graph (expected return us volatility) shouring all the three assets and the tangency portfolio. Sketch the efficient frontier of risky assets. Draw the capital allocation line. Assume now that the CAPM holds. Compute the betas of the three assets and draw a expected return us. beta graph. Show the three assets and the tangency portfolio on this graph. Problem 2. Consider two stocks: WMT and IBM with the following properties Stark Rr) ar

Step by Step Solution

There are 3 Steps involved in it

Step: 1

blur-text-image

Get Instant Access to Expert-Tailored Solutions

See step-by-step solutions with expert insights and AI powered tools for academic success

Step: 2

blur-text-image

Step: 3

blur-text-image

Ace Your Homework with AI

Get the answers you need in no time with our AI-driven, step-by-step assistance

Get Started

Recommended Textbook for

Practical financial management

Authors: William r. Lasher

5th Edition

0324422636, 978-0324422634

More Books

Students also viewed these Finance questions