

Answered step by step
Verified Expert Solution
Question
1 Approved Answer
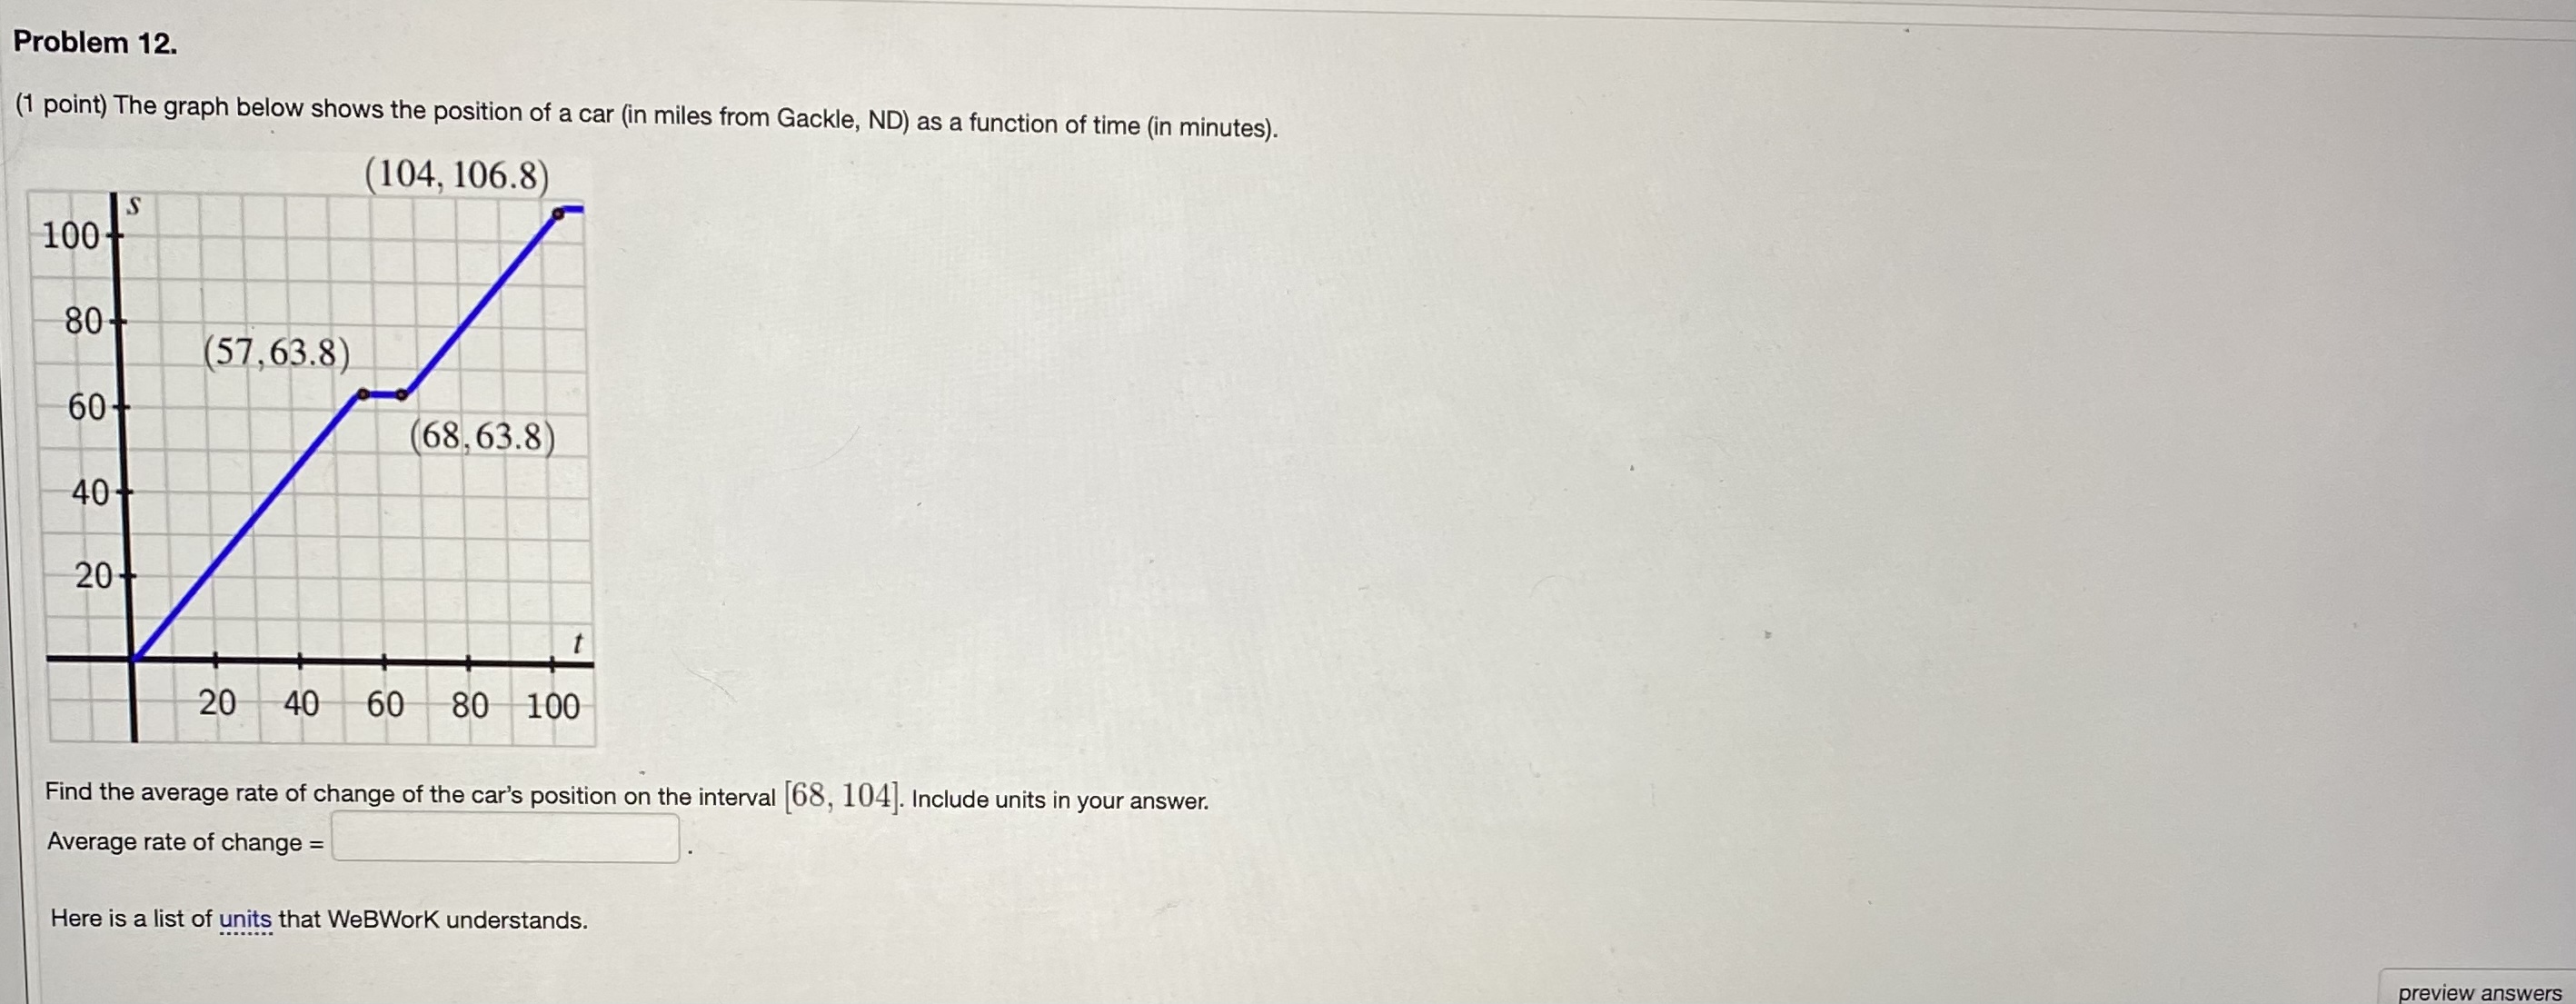
Problem 12. (1 point) The graph below shows the position of a car (in miles from Gackle, ND) as a function of time (in minutes).

Step by Step Solution
There are 3 Steps involved in it
Step: 1

Get Instant Access to Expert-Tailored Solutions
See step-by-step solutions with expert insights and AI powered tools for academic success
Step: 2

Step: 3
Ace Your Homework with AI
Get the answers you need in no time with our AI-driven, step-by-step assistance
Get Started
College Geometry A Discovery Approach
Authors: David Kay
2nd Edition
0321830954, 9780321830951